

If you’re a Tier 1 automotive supplier, your margins are thinner than your OEM customers’. GM runs a 3.2% net margin. Ford swings between profit and loss. But Tier 1 suppliers -- the companies that actually build the parts -- often operate at 2-4% net margins while managing material costs that consume 60-70% of every revenue dollar.
That margin compression makes procurement savings disproportionately valuable. At a 5% net margin, $1 saved in procurement equals $20 in new sales. At 2.4% -- Magna International’s actual 2024 net margin -- it equals $42.
That’s not a rounding error. It means a Tier 1 supplier would need to win $42 million in new OEM business to generate the same bottom-line profit as $1 million in procurement savings. The new business requires engineering investment, tooling, launch costs, quality systems, and years of amortization. The procurement savings require a better RFQ process and a more rigorous approach to should-cost modeling.
This post walks through the math using real income statements, shows where the savings live, and explains why the 10-15% opportunity that structured procurement programs consistently deliver is the single most important financial lever available to most automotive suppliers.
The Magna Income Statement: A Real-World Example
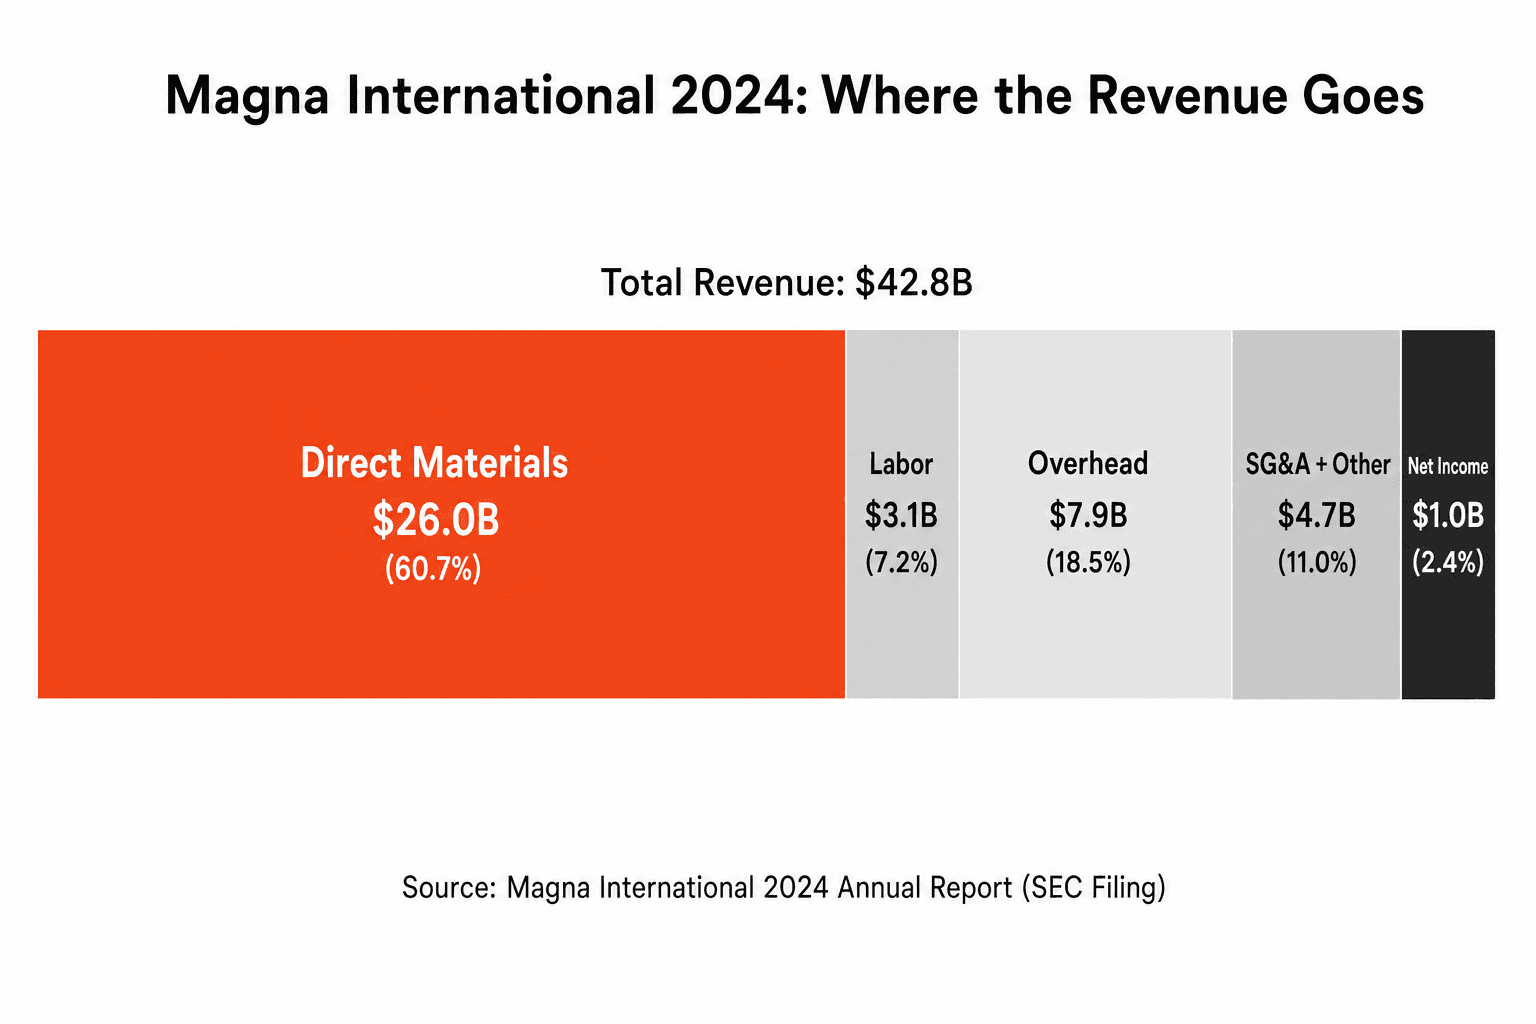
Magna International is the world’s third-largest automotive supplier by revenue. Its 2024 10-K filing makes the procurement math concrete with real, audited numbers.
Line Item | Amount | As % of Revenue |
|---|---|---|
Total Revenue | $42.8B | 100% |
Cost of Goods Sold | $37.0B | 86.5% |
— Direct Materials | $26.0B | 60.7% |
— Direct Labor | $3.1B | 7.2% |
— Overhead | $7.9B | 18.5% |
Net Income | $1.01B | 2.4% |
Direct materials alone -- raw materials, purchased components, sub-assemblies from Tier 2 suppliers -- consume $26 billion of Magna’s $42.8 billion in revenue. That’s 70% of COGS and 61% of total revenue going directly to material purchases.
Now apply the math:
1% savings on direct materials: $260 million straight to net income
Equivalent new OEM sales needed to generate $260M at 2.4% margin: $10.8 billion
For context: Magna’s total 2024 revenue was $42.8B. A 1% procurement improvement delivers the same profit as a 25% increase in revenue.
A 5% procurement improvement would add $1.3 billion to Magna’s bottom line -- more than its entire 2024 net income of $1.01 billion.
The Multiplier: Why Savings Beat Sales
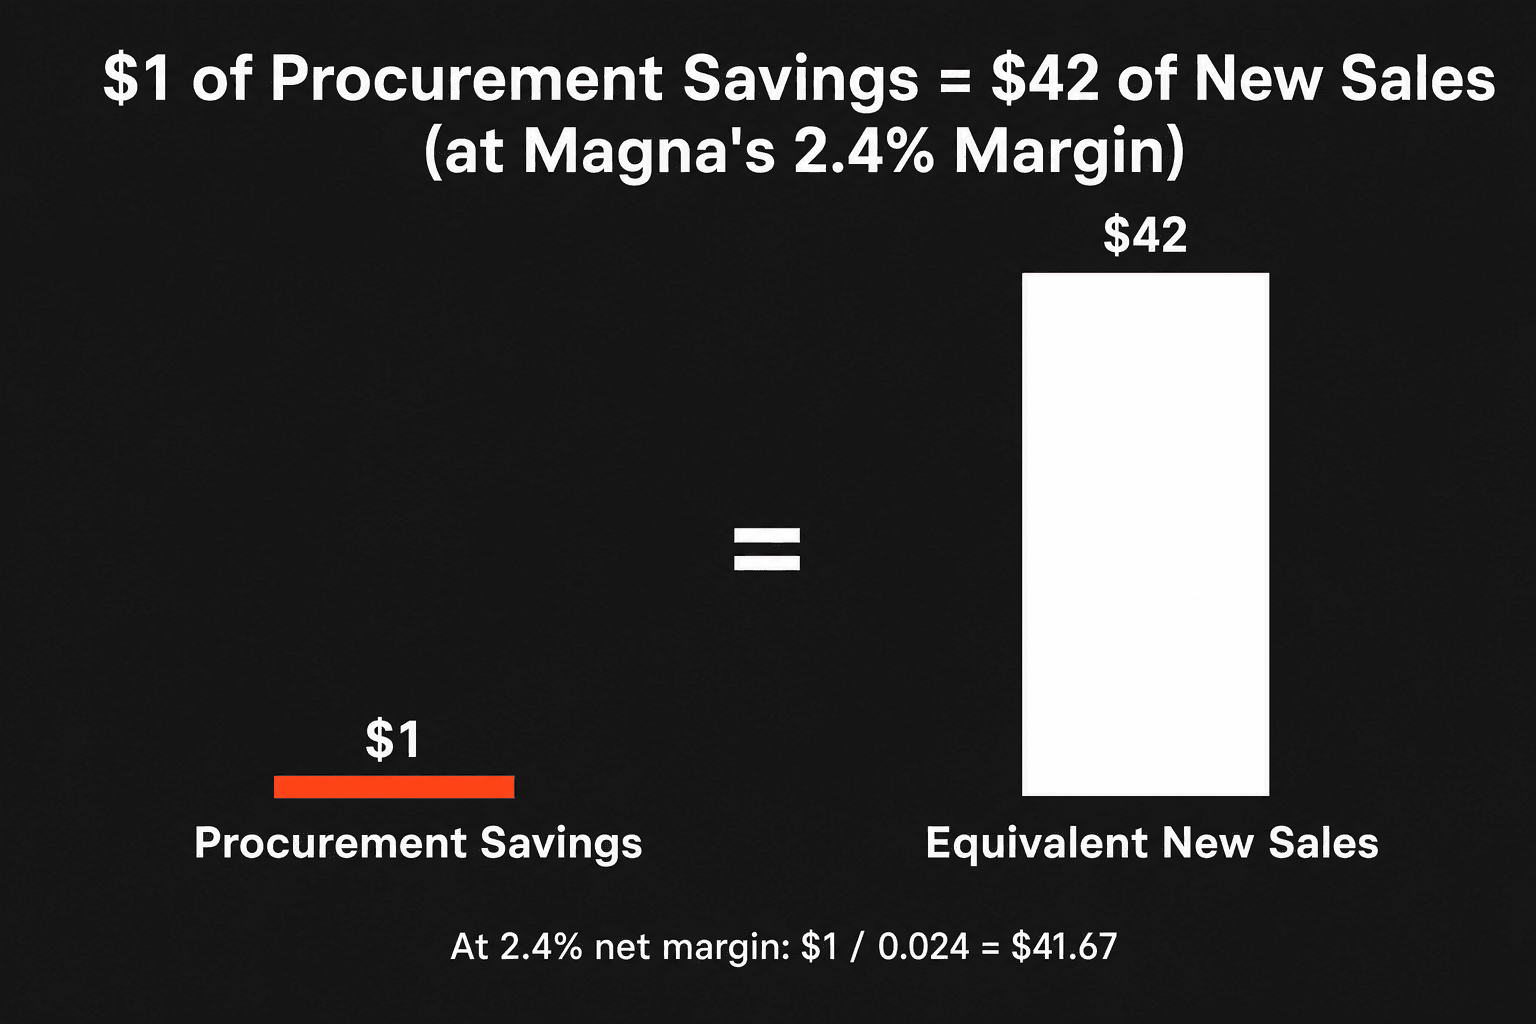
The math is straightforward. Revenue flows through the entire cost structure before reaching profit. Cost of goods, SG&A, interest, and taxes consume most of every sales dollar. At a 2.4% net margin, only 2.4 cents of every revenue dollar reaches the bottom line. A dollar saved in procurement drops entirely to profit -- no COGS, no sales commission, no incremental overhead.
The formula: $1 saved = $1 / net margin = equivalent new sales. At Magna’s 2.4%, that’s $1 / 0.024 = $41.67. Round it: $42.
Here’s how the multiplier works across common Tier 1 profiles:
Net Margin | $1 Saved = | $10M Saved = | Example Company |
|---|---|---|---|
1.5% | $67 in new sales | $667M in new sales | Stressed Tier 1 (EV transition) |
2.4% | $42 in new sales | $417M in new sales | Magna (2024 actual) |
3.5% | $29 in new sales | $286M in new sales | Healthy mid-market Tier 1 |
5.0% | $20 in new sales | $200M in new sales | Strong specialty supplier |
7.0% | $14 in new sales | $143M in new sales | High-value-add Tier 1 |
The lower your margin, the more valuable every dollar of procurement savings becomes. And automotive Tier 1 suppliers, on average, run lower margins than their OEM customers -- meaning the multiplier is even more dramatic than at the OEM level.
Where 80% of Your Spend Lives
For most manufacturers in the $500M-$5B revenue range, the spend breakdown follows a consistent pattern:
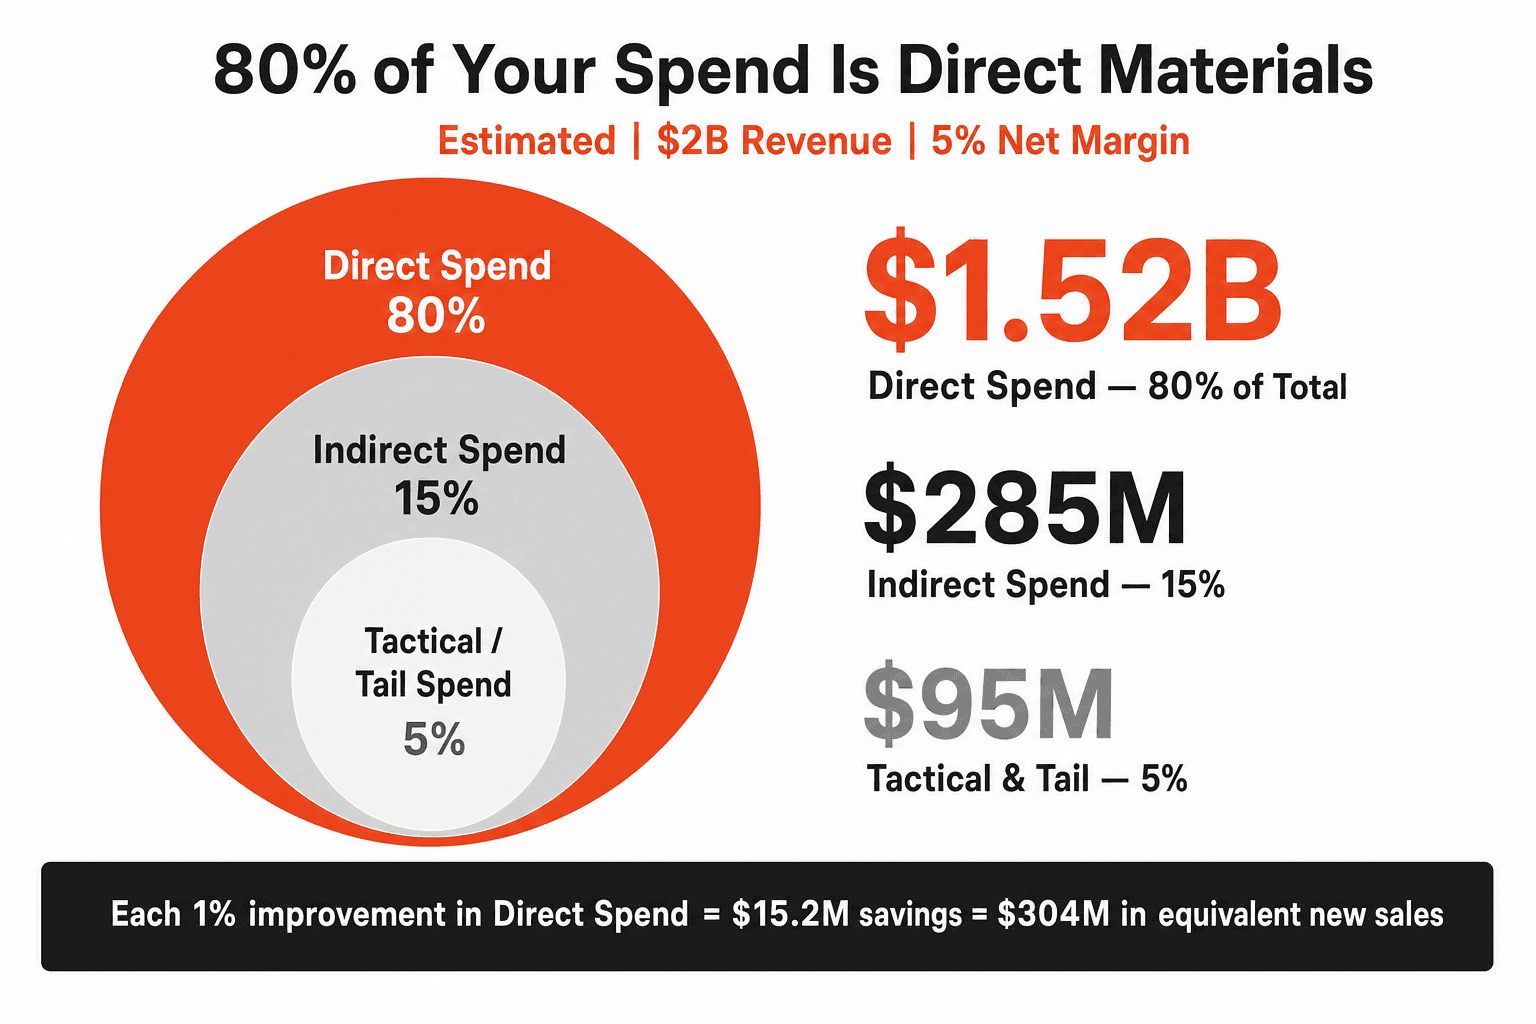
For a typical $2 billion Tier 1 supplier running a 5% net margin:
Direct spend: $1.52 billion (80% of total addressable procurement spend)
Indirect spend: $285 million (15%)
Tactical indirect and tail: $95 million (5%)
Each 1-point improvement in direct spend delivers $15.2 million to the cost reduction goal. That $15.2 million in savings is financially equivalent to increasing top-line sales by approximately $304 million -- or a 76 basis-point margin improvement.
The majority of this spend is managed outside of an operating system of record. The legacy approach is fragmented, highly manual, and results in approximately a 30% error rate that causes rework. Buyers receive spec packages via email, normalize quotes in Excel, and make award decisions based on incomplete data. The sourcing bottleneck isn’t just an operational annoyance -- it’s money left on the table every time a suboptimal award goes through because the process couldn’t surface a better option.
What the Consulting Firms Have Documented
The 10-15% savings range isn’t a marketing number. It’s documented across multiple tier-one consulting firms:
Bain & Company: Achieved €31 million in savings within a year for a global industrial components manufacturer -- an 11% reduction in purchasing costs. The client had already cut 14% in a prior program, yet Bain’s structured approach identified another 11% through standardizing parts, global sourcing, and supplier consolidation.
McKinsey: Reports that 15% bottom-line savings on external spend is typically achievable in a focused procurement effort, equating to a 5-10% reduction in the overall cost base. In one automotive case, machine learning applied to purchasing data identified 10-25% savings potential by eliminating duplicate spend and optimizing part specifications. A truck manufacturer used analytics to consolidate similar parts and saved €20+ million.
BCG: A cost program for a global manufacturer identified $1 billion+ in total savings, with 8-10% cost savings potential across sourcing categories -- even higher in plastics and electrical components.
Brose Group: The German Tier 1 supplier (mechatronic components for doors and seats) achieved up to 15% reduction in part procurement costs by implementing a product cost management system that standardized should-cost models across the organization.
The pattern: structured sourcing programs that combine data analytics, competitive bidding, supplier performance visibility, and should-cost modeling consistently deliver 10-15% on addressed spend. The companies that don’t achieve these numbers aren’t failing because the savings don’t exist. They’re failing because their procurement processes are too manual, too fragmented, and too dependent on individual buyer knowledge to capture them systematically.
Why Tier 1 Suppliers Have More Opportunity Than OEMs
OEMs have spent decades investing in procurement infrastructure -- dedicated commodity managers, global sourcing offices, sophisticated should-cost tools. Tier 1 suppliers, by contrast, often run leaner procurement organizations relative to their spend volumes.
Three structural factors make the opportunity larger for Tier 1s:
1. Less procurement infrastructure per dollar of spend. A $3 billion Tier 1 might have 15-25 buyers covering hundreds of commodities. A $180 billion OEM has entire departments for each material family. The Tier 1’s buyers are stretched thinner, which means more categories go unsourced competitively.
2. More single-sourced categories. When a buyer is managing 200 supplier relationships, the path of least resistance is to renew with the incumbent. Categories that have never been competitively bid are categories where the incumbent price is the only price -- and that price hasn’t been tested against the market in years.
3. Higher material-to-revenue ratio. Tier 1 suppliers often have material costs of 60-70% of revenue (vs. 50-55% at OEMs that retain more vertical integration). The addressable base is proportionally larger.
The result: the same 10-15% savings rate applied to a larger proportional spend base, with a higher profit multiplier due to lower margins, generates even more relative impact for Tier 1s than for OEMs.
What This Means for the CFO
For a $2 billion Tier 1 supplier at 5% net margin:
Total direct spend: $1.52 billion
10% savings on direct spend: $152 million
Equivalent new OEM sales at 5% margin: $3.04 billion
As % of current revenue: 152% -- you’d need to more than double your revenue through new sales to match what procurement optimization can deliver
For the CFO: procurement savings flow directly to EBITDA and net income. They require no incremental working capital, no engineering investment for new programs, no launch costs, and no multi-year amortization schedule. The ROI on procurement technology and process improvement is typically 5-10x within the first year.
For the CPO: the multiplier is the most effective tool for securing budget and headcount. When you can show the board that $1 invested in procurement capability generates $20-42 in equivalent revenue, the business case writes itself.
For the CEO: in an industry facing tariff uncertainty, EV transition costs, and supply chain disruptions, procurement is the fastest path to margin recovery. It doesn’t require new customers, new products, or new markets. It requires doing what you’re already doing -- buying materials -- with better data, better processes, and better tools.
At LightSource, this is the core of the platform. AI-native sourcing that brings competitive visibility, should-cost intelligence, and structured supplier engagement to the categories that represent 80% of total spend. The 10-15% savings isn’t aspirational. It’s what happens when you move the largest cost line from spreadsheets and email into a system designed to find value systematically.
The math on procurement savings is not subtle. At Tier 1 margins, every dollar saved in direct materials is worth $20-42 in new OEM sales. Magna’s income statement shows a $26 billion direct materials line where a 1% improvement delivers $260 million to the bottom line. The consulting firms have documented 10-15% savings potential across hundreds of engagements. And the structural characteristics of Tier 1 procurement -- lean teams, proportionally larger spend, more single-sourced categories -- mean the opportunity is often bigger, not smaller, than at the OEM level.
The question isn’t whether the savings exist. It’s whether your procurement process is equipped to find them.
Sources
Magna International 2024 Annual Report / 10-K -- Revenue $42.8B, COGS $37.0B (materials $26.0B, labor $3.1B, overhead $7.9B), net income $1.01B
GM 2024 10-K (SEC Filing) -- Direct materials ~66% of automotive COGS; revenue $187.4B, net income $6.0B
Bain & Company -- Uncovering Major Savings in Procurement -- €31M savings (11% reduction) for industrial manufacturer
McKinsey -- Rapid Procurement Transformation -- 15% bottom-line savings on external spend typical
McKinsey -- Automotive ML Procurement Case -- 10-25% savings via ML; truck manufacturer saved €20M+
BCG -- Cost Competitiveness for Consumer Durables -- $1B+ savings identified; 8-10% per category
Market Realist -- Raw Materials as Cost Driver in Auto Industry -- Raw materials ~47% of vehicle cost
Automotive Logistics -- OEMs Slashing Costs in 2025 -- Industry margin compression context
Frequently Asked Questions
Why is $1 of procurement savings worth more than $1 of new revenue?
Revenue flows through the entire cost structure before reaching profit. At a 2.4% net margin (Magna’s 2024 actual), only 2.4 cents of every revenue dollar reaches the bottom line. A dollar saved in procurement drops entirely to profit with no incremental costs. At 2.4% margins, $1 saved has the same profit impact as $42 of new sales. At 5% margins, it’s $20. The lower the margin, the more dramatic the multiplier.
What percentage of a Tier 1 supplier’s costs are direct materials?
Magna International’s 2024 filing shows direct materials at $26.0 billion out of $37.0 billion in total COGS -- 70% of cost of goods sold and 61% of total revenue. Industry-wide, automotive Tier 1 suppliers typically spend 60-70% of their COGS on purchased materials and components, making procurement the single largest controllable cost line.
How much can procurement savings realistically deliver for a Tier 1 supplier?
Tier-one consulting firms consistently document 10-15% savings on addressed spend through structured procurement programs. Bain achieved 11% for an industrial manufacturer, McKinsey reports 15% as typical, BCG found 8-10% per category, and Brose Group achieved 15% on part procurement costs. These are audited, published results. For a $2 billion Tier 1 at 80% direct spend, 10% savings = $152 million -- equivalent to $3 billion in new sales at 5% margins.
Why do Tier 1 suppliers often have more procurement savings opportunity than OEMs?
Three structural factors: leaner procurement teams relative to spend volume (more categories go unsourced competitively), more single-sourced categories (incumbent pricing hasn’t been market-tested), and higher material-to-revenue ratios (60-70% vs 50-55% at more vertically integrated OEMs). The same savings rate applied to a proportionally larger base, with a higher multiplier from lower margins, generates more relative impact.
How does LightSource help Tier 1 suppliers find 10-15% savings?
LightSource drives savings through competitive visibility across under-sourced categories, AI-assisted specification optimization on BOM data, automated quote normalization for apples-to-apples comparison, historical benchmarking against every prior bid, and cycle-time compression that frees buyers to negotiate rather than administrate. The platform is purpose-built for direct materials procurement -- the 80% of spend where the savings opportunity is largest.
What should a Tier 1 CFO prioritize first?
Start with competitive visibility on your top 20 spend categories by dollar volume. Many of these categories have been single-sourced for years with no market-tested pricing. Running structured competitive events on just the top 20 categories typically surfaces 60-70% of the total savings opportunity. The ROI on procurement technology is typically 5-10x within the first year, with savings flowing directly to EBITDA and net income.
If you’re a Tier 1 automotive supplier, your margins are thinner than your OEM customers’. GM runs a 3.2% net margin. Ford swings between profit and loss. But Tier 1 suppliers -- the companies that actually build the parts -- often operate at 2-4% net margins while managing material costs that consume 60-70% of every revenue dollar.
That margin compression makes procurement savings disproportionately valuable. At a 5% net margin, $1 saved in procurement equals $20 in new sales. At 2.4% -- Magna International’s actual 2024 net margin -- it equals $42.
That’s not a rounding error. It means a Tier 1 supplier would need to win $42 million in new OEM business to generate the same bottom-line profit as $1 million in procurement savings. The new business requires engineering investment, tooling, launch costs, quality systems, and years of amortization. The procurement savings require a better RFQ process and a more rigorous approach to should-cost modeling.
This post walks through the math using real income statements, shows where the savings live, and explains why the 10-15% opportunity that structured procurement programs consistently deliver is the single most important financial lever available to most automotive suppliers.
The Magna Income Statement: A Real-World Example
Magna International is the world’s third-largest automotive supplier by revenue. Its 2024 10-K filing makes the procurement math concrete with real, audited numbers.
Line Item | Amount | As % of Revenue |
|---|---|---|
Total Revenue | $42.8B | 100% |
Cost of Goods Sold | $37.0B | 86.5% |
— Direct Materials | $26.0B | 60.7% |
— Direct Labor | $3.1B | 7.2% |
— Overhead | $7.9B | 18.5% |
Net Income | $1.01B | 2.4% |
Direct materials alone -- raw materials, purchased components, sub-assemblies from Tier 2 suppliers -- consume $26 billion of Magna’s $42.8 billion in revenue. That’s 70% of COGS and 61% of total revenue going directly to material purchases.
Now apply the math:
1% savings on direct materials: $260 million straight to net income
Equivalent new OEM sales needed to generate $260M at 2.4% margin: $10.8 billion
For context: Magna’s total 2024 revenue was $42.8B. A 1% procurement improvement delivers the same profit as a 25% increase in revenue.
A 5% procurement improvement would add $1.3 billion to Magna’s bottom line -- more than its entire 2024 net income of $1.01 billion.
The Multiplier: Why Savings Beat Sales
The math is straightforward. Revenue flows through the entire cost structure before reaching profit. Cost of goods, SG&A, interest, and taxes consume most of every sales dollar. At a 2.4% net margin, only 2.4 cents of every revenue dollar reaches the bottom line. A dollar saved in procurement drops entirely to profit -- no COGS, no sales commission, no incremental overhead.
The formula: $1 saved = $1 / net margin = equivalent new sales. At Magna’s 2.4%, that’s $1 / 0.024 = $41.67. Round it: $42.
Here’s how the multiplier works across common Tier 1 profiles:
Net Margin | $1 Saved = | $10M Saved = | Example Company |
|---|---|---|---|
1.5% | $67 in new sales | $667M in new sales | Stressed Tier 1 (EV transition) |
2.4% | $42 in new sales | $417M in new sales | Magna (2024 actual) |
3.5% | $29 in new sales | $286M in new sales | Healthy mid-market Tier 1 |
5.0% | $20 in new sales | $200M in new sales | Strong specialty supplier |
7.0% | $14 in new sales | $143M in new sales | High-value-add Tier 1 |
The lower your margin, the more valuable every dollar of procurement savings becomes. And automotive Tier 1 suppliers, on average, run lower margins than their OEM customers -- meaning the multiplier is even more dramatic than at the OEM level.
Where 80% of Your Spend Lives
For most manufacturers in the $500M-$5B revenue range, the spend breakdown follows a consistent pattern:
For a typical $2 billion Tier 1 supplier running a 5% net margin:
Direct spend: $1.52 billion (80% of total addressable procurement spend)
Indirect spend: $285 million (15%)
Tactical indirect and tail: $95 million (5%)
Each 1-point improvement in direct spend delivers $15.2 million to the cost reduction goal. That $15.2 million in savings is financially equivalent to increasing top-line sales by approximately $304 million -- or a 76 basis-point margin improvement.
The majority of this spend is managed outside of an operating system of record. The legacy approach is fragmented, highly manual, and results in approximately a 30% error rate that causes rework. Buyers receive spec packages via email, normalize quotes in Excel, and make award decisions based on incomplete data. The sourcing bottleneck isn’t just an operational annoyance -- it’s money left on the table every time a suboptimal award goes through because the process couldn’t surface a better option.
What the Consulting Firms Have Documented
The 10-15% savings range isn’t a marketing number. It’s documented across multiple tier-one consulting firms:
Bain & Company: Achieved €31 million in savings within a year for a global industrial components manufacturer -- an 11% reduction in purchasing costs. The client had already cut 14% in a prior program, yet Bain’s structured approach identified another 11% through standardizing parts, global sourcing, and supplier consolidation.
McKinsey: Reports that 15% bottom-line savings on external spend is typically achievable in a focused procurement effort, equating to a 5-10% reduction in the overall cost base. In one automotive case, machine learning applied to purchasing data identified 10-25% savings potential by eliminating duplicate spend and optimizing part specifications. A truck manufacturer used analytics to consolidate similar parts and saved €20+ million.
BCG: A cost program for a global manufacturer identified $1 billion+ in total savings, with 8-10% cost savings potential across sourcing categories -- even higher in plastics and electrical components.
Brose Group: The German Tier 1 supplier (mechatronic components for doors and seats) achieved up to 15% reduction in part procurement costs by implementing a product cost management system that standardized should-cost models across the organization.
The pattern: structured sourcing programs that combine data analytics, competitive bidding, supplier performance visibility, and should-cost modeling consistently deliver 10-15% on addressed spend. The companies that don’t achieve these numbers aren’t failing because the savings don’t exist. They’re failing because their procurement processes are too manual, too fragmented, and too dependent on individual buyer knowledge to capture them systematically.
Why Tier 1 Suppliers Have More Opportunity Than OEMs
OEMs have spent decades investing in procurement infrastructure -- dedicated commodity managers, global sourcing offices, sophisticated should-cost tools. Tier 1 suppliers, by contrast, often run leaner procurement organizations relative to their spend volumes.
Three structural factors make the opportunity larger for Tier 1s:
1. Less procurement infrastructure per dollar of spend. A $3 billion Tier 1 might have 15-25 buyers covering hundreds of commodities. A $180 billion OEM has entire departments for each material family. The Tier 1’s buyers are stretched thinner, which means more categories go unsourced competitively.
2. More single-sourced categories. When a buyer is managing 200 supplier relationships, the path of least resistance is to renew with the incumbent. Categories that have never been competitively bid are categories where the incumbent price is the only price -- and that price hasn’t been tested against the market in years.
3. Higher material-to-revenue ratio. Tier 1 suppliers often have material costs of 60-70% of revenue (vs. 50-55% at OEMs that retain more vertical integration). The addressable base is proportionally larger.
The result: the same 10-15% savings rate applied to a larger proportional spend base, with a higher profit multiplier due to lower margins, generates even more relative impact for Tier 1s than for OEMs.
What This Means for the CFO
For a $2 billion Tier 1 supplier at 5% net margin:
Total direct spend: $1.52 billion
10% savings on direct spend: $152 million
Equivalent new OEM sales at 5% margin: $3.04 billion
As % of current revenue: 152% -- you’d need to more than double your revenue through new sales to match what procurement optimization can deliver
For the CFO: procurement savings flow directly to EBITDA and net income. They require no incremental working capital, no engineering investment for new programs, no launch costs, and no multi-year amortization schedule. The ROI on procurement technology and process improvement is typically 5-10x within the first year.
For the CPO: the multiplier is the most effective tool for securing budget and headcount. When you can show the board that $1 invested in procurement capability generates $20-42 in equivalent revenue, the business case writes itself.
For the CEO: in an industry facing tariff uncertainty, EV transition costs, and supply chain disruptions, procurement is the fastest path to margin recovery. It doesn’t require new customers, new products, or new markets. It requires doing what you’re already doing -- buying materials -- with better data, better processes, and better tools.
At LightSource, this is the core of the platform. AI-native sourcing that brings competitive visibility, should-cost intelligence, and structured supplier engagement to the categories that represent 80% of total spend. The 10-15% savings isn’t aspirational. It’s what happens when you move the largest cost line from spreadsheets and email into a system designed to find value systematically.
The math on procurement savings is not subtle. At Tier 1 margins, every dollar saved in direct materials is worth $20-42 in new OEM sales. Magna’s income statement shows a $26 billion direct materials line where a 1% improvement delivers $260 million to the bottom line. The consulting firms have documented 10-15% savings potential across hundreds of engagements. And the structural characteristics of Tier 1 procurement -- lean teams, proportionally larger spend, more single-sourced categories -- mean the opportunity is often bigger, not smaller, than at the OEM level.
The question isn’t whether the savings exist. It’s whether your procurement process is equipped to find them.
Sources
Magna International 2024 Annual Report / 10-K -- Revenue $42.8B, COGS $37.0B (materials $26.0B, labor $3.1B, overhead $7.9B), net income $1.01B
GM 2024 10-K (SEC Filing) -- Direct materials ~66% of automotive COGS; revenue $187.4B, net income $6.0B
Bain & Company -- Uncovering Major Savings in Procurement -- €31M savings (11% reduction) for industrial manufacturer
McKinsey -- Rapid Procurement Transformation -- 15% bottom-line savings on external spend typical
McKinsey -- Automotive ML Procurement Case -- 10-25% savings via ML; truck manufacturer saved €20M+
BCG -- Cost Competitiveness for Consumer Durables -- $1B+ savings identified; 8-10% per category
Market Realist -- Raw Materials as Cost Driver in Auto Industry -- Raw materials ~47% of vehicle cost
Automotive Logistics -- OEMs Slashing Costs in 2025 -- Industry margin compression context
Frequently Asked Questions
Why is $1 of procurement savings worth more than $1 of new revenue?
Revenue flows through the entire cost structure before reaching profit. At a 2.4% net margin (Magna’s 2024 actual), only 2.4 cents of every revenue dollar reaches the bottom line. A dollar saved in procurement drops entirely to profit with no incremental costs. At 2.4% margins, $1 saved has the same profit impact as $42 of new sales. At 5% margins, it’s $20. The lower the margin, the more dramatic the multiplier.
What percentage of a Tier 1 supplier’s costs are direct materials?
Magna International’s 2024 filing shows direct materials at $26.0 billion out of $37.0 billion in total COGS -- 70% of cost of goods sold and 61% of total revenue. Industry-wide, automotive Tier 1 suppliers typically spend 60-70% of their COGS on purchased materials and components, making procurement the single largest controllable cost line.
How much can procurement savings realistically deliver for a Tier 1 supplier?
Tier-one consulting firms consistently document 10-15% savings on addressed spend through structured procurement programs. Bain achieved 11% for an industrial manufacturer, McKinsey reports 15% as typical, BCG found 8-10% per category, and Brose Group achieved 15% on part procurement costs. These are audited, published results. For a $2 billion Tier 1 at 80% direct spend, 10% savings = $152 million -- equivalent to $3 billion in new sales at 5% margins.
Why do Tier 1 suppliers often have more procurement savings opportunity than OEMs?
Three structural factors: leaner procurement teams relative to spend volume (more categories go unsourced competitively), more single-sourced categories (incumbent pricing hasn’t been market-tested), and higher material-to-revenue ratios (60-70% vs 50-55% at more vertically integrated OEMs). The same savings rate applied to a proportionally larger base, with a higher multiplier from lower margins, generates more relative impact.
How does LightSource help Tier 1 suppliers find 10-15% savings?
LightSource drives savings through competitive visibility across under-sourced categories, AI-assisted specification optimization on BOM data, automated quote normalization for apples-to-apples comparison, historical benchmarking against every prior bid, and cycle-time compression that frees buyers to negotiate rather than administrate. The platform is purpose-built for direct materials procurement -- the 80% of spend where the savings opportunity is largest.
What should a Tier 1 CFO prioritize first?
Start with competitive visibility on your top 20 spend categories by dollar volume. Many of these categories have been single-sourced for years with no market-tested pricing. Running structured competitive events on just the top 20 categories typically surfaces 60-70% of the total savings opportunity. The ROI on procurement technology is typically 5-10x within the first year, with savings flowing directly to EBITDA and net income.
If you’re a Tier 1 automotive supplier, your margins are thinner than your OEM customers’. GM runs a 3.2% net margin. Ford swings between profit and loss. But Tier 1 suppliers -- the companies that actually build the parts -- often operate at 2-4% net margins while managing material costs that consume 60-70% of every revenue dollar.
That margin compression makes procurement savings disproportionately valuable. At a 5% net margin, $1 saved in procurement equals $20 in new sales. At 2.4% -- Magna International’s actual 2024 net margin -- it equals $42.
That’s not a rounding error. It means a Tier 1 supplier would need to win $42 million in new OEM business to generate the same bottom-line profit as $1 million in procurement savings. The new business requires engineering investment, tooling, launch costs, quality systems, and years of amortization. The procurement savings require a better RFQ process and a more rigorous approach to should-cost modeling.
This post walks through the math using real income statements, shows where the savings live, and explains why the 10-15% opportunity that structured procurement programs consistently deliver is the single most important financial lever available to most automotive suppliers.
The Magna Income Statement: A Real-World Example
Magna International is the world’s third-largest automotive supplier by revenue. Its 2024 10-K filing makes the procurement math concrete with real, audited numbers.
Line Item | Amount | As % of Revenue |
|---|---|---|
Total Revenue | $42.8B | 100% |
Cost of Goods Sold | $37.0B | 86.5% |
— Direct Materials | $26.0B | 60.7% |
— Direct Labor | $3.1B | 7.2% |
— Overhead | $7.9B | 18.5% |
Net Income | $1.01B | 2.4% |
Direct materials alone -- raw materials, purchased components, sub-assemblies from Tier 2 suppliers -- consume $26 billion of Magna’s $42.8 billion in revenue. That’s 70% of COGS and 61% of total revenue going directly to material purchases.
Now apply the math:
1% savings on direct materials: $260 million straight to net income
Equivalent new OEM sales needed to generate $260M at 2.4% margin: $10.8 billion
For context: Magna’s total 2024 revenue was $42.8B. A 1% procurement improvement delivers the same profit as a 25% increase in revenue.
A 5% procurement improvement would add $1.3 billion to Magna’s bottom line -- more than its entire 2024 net income of $1.01 billion.
The Multiplier: Why Savings Beat Sales
The math is straightforward. Revenue flows through the entire cost structure before reaching profit. Cost of goods, SG&A, interest, and taxes consume most of every sales dollar. At a 2.4% net margin, only 2.4 cents of every revenue dollar reaches the bottom line. A dollar saved in procurement drops entirely to profit -- no COGS, no sales commission, no incremental overhead.
The formula: $1 saved = $1 / net margin = equivalent new sales. At Magna’s 2.4%, that’s $1 / 0.024 = $41.67. Round it: $42.
Here’s how the multiplier works across common Tier 1 profiles:
Net Margin | $1 Saved = | $10M Saved = | Example Company |
|---|---|---|---|
1.5% | $67 in new sales | $667M in new sales | Stressed Tier 1 (EV transition) |
2.4% | $42 in new sales | $417M in new sales | Magna (2024 actual) |
3.5% | $29 in new sales | $286M in new sales | Healthy mid-market Tier 1 |
5.0% | $20 in new sales | $200M in new sales | Strong specialty supplier |
7.0% | $14 in new sales | $143M in new sales | High-value-add Tier 1 |
The lower your margin, the more valuable every dollar of procurement savings becomes. And automotive Tier 1 suppliers, on average, run lower margins than their OEM customers -- meaning the multiplier is even more dramatic than at the OEM level.
Where 80% of Your Spend Lives
For most manufacturers in the $500M-$5B revenue range, the spend breakdown follows a consistent pattern:
For a typical $2 billion Tier 1 supplier running a 5% net margin:
Direct spend: $1.52 billion (80% of total addressable procurement spend)
Indirect spend: $285 million (15%)
Tactical indirect and tail: $95 million (5%)
Each 1-point improvement in direct spend delivers $15.2 million to the cost reduction goal. That $15.2 million in savings is financially equivalent to increasing top-line sales by approximately $304 million -- or a 76 basis-point margin improvement.
The majority of this spend is managed outside of an operating system of record. The legacy approach is fragmented, highly manual, and results in approximately a 30% error rate that causes rework. Buyers receive spec packages via email, normalize quotes in Excel, and make award decisions based on incomplete data. The sourcing bottleneck isn’t just an operational annoyance -- it’s money left on the table every time a suboptimal award goes through because the process couldn’t surface a better option.
What the Consulting Firms Have Documented
The 10-15% savings range isn’t a marketing number. It’s documented across multiple tier-one consulting firms:
Bain & Company: Achieved €31 million in savings within a year for a global industrial components manufacturer -- an 11% reduction in purchasing costs. The client had already cut 14% in a prior program, yet Bain’s structured approach identified another 11% through standardizing parts, global sourcing, and supplier consolidation.
McKinsey: Reports that 15% bottom-line savings on external spend is typically achievable in a focused procurement effort, equating to a 5-10% reduction in the overall cost base. In one automotive case, machine learning applied to purchasing data identified 10-25% savings potential by eliminating duplicate spend and optimizing part specifications. A truck manufacturer used analytics to consolidate similar parts and saved €20+ million.
BCG: A cost program for a global manufacturer identified $1 billion+ in total savings, with 8-10% cost savings potential across sourcing categories -- even higher in plastics and electrical components.
Brose Group: The German Tier 1 supplier (mechatronic components for doors and seats) achieved up to 15% reduction in part procurement costs by implementing a product cost management system that standardized should-cost models across the organization.
The pattern: structured sourcing programs that combine data analytics, competitive bidding, supplier performance visibility, and should-cost modeling consistently deliver 10-15% on addressed spend. The companies that don’t achieve these numbers aren’t failing because the savings don’t exist. They’re failing because their procurement processes are too manual, too fragmented, and too dependent on individual buyer knowledge to capture them systematically.
Why Tier 1 Suppliers Have More Opportunity Than OEMs
OEMs have spent decades investing in procurement infrastructure -- dedicated commodity managers, global sourcing offices, sophisticated should-cost tools. Tier 1 suppliers, by contrast, often run leaner procurement organizations relative to their spend volumes.
Three structural factors make the opportunity larger for Tier 1s:
1. Less procurement infrastructure per dollar of spend. A $3 billion Tier 1 might have 15-25 buyers covering hundreds of commodities. A $180 billion OEM has entire departments for each material family. The Tier 1’s buyers are stretched thinner, which means more categories go unsourced competitively.
2. More single-sourced categories. When a buyer is managing 200 supplier relationships, the path of least resistance is to renew with the incumbent. Categories that have never been competitively bid are categories where the incumbent price is the only price -- and that price hasn’t been tested against the market in years.
3. Higher material-to-revenue ratio. Tier 1 suppliers often have material costs of 60-70% of revenue (vs. 50-55% at OEMs that retain more vertical integration). The addressable base is proportionally larger.
The result: the same 10-15% savings rate applied to a larger proportional spend base, with a higher profit multiplier due to lower margins, generates even more relative impact for Tier 1s than for OEMs.
What This Means for the CFO
For a $2 billion Tier 1 supplier at 5% net margin:
Total direct spend: $1.52 billion
10% savings on direct spend: $152 million
Equivalent new OEM sales at 5% margin: $3.04 billion
As % of current revenue: 152% -- you’d need to more than double your revenue through new sales to match what procurement optimization can deliver
For the CFO: procurement savings flow directly to EBITDA and net income. They require no incremental working capital, no engineering investment for new programs, no launch costs, and no multi-year amortization schedule. The ROI on procurement technology and process improvement is typically 5-10x within the first year.
For the CPO: the multiplier is the most effective tool for securing budget and headcount. When you can show the board that $1 invested in procurement capability generates $20-42 in equivalent revenue, the business case writes itself.
For the CEO: in an industry facing tariff uncertainty, EV transition costs, and supply chain disruptions, procurement is the fastest path to margin recovery. It doesn’t require new customers, new products, or new markets. It requires doing what you’re already doing -- buying materials -- with better data, better processes, and better tools.
At LightSource, this is the core of the platform. AI-native sourcing that brings competitive visibility, should-cost intelligence, and structured supplier engagement to the categories that represent 80% of total spend. The 10-15% savings isn’t aspirational. It’s what happens when you move the largest cost line from spreadsheets and email into a system designed to find value systematically.
The math on procurement savings is not subtle. At Tier 1 margins, every dollar saved in direct materials is worth $20-42 in new OEM sales. Magna’s income statement shows a $26 billion direct materials line where a 1% improvement delivers $260 million to the bottom line. The consulting firms have documented 10-15% savings potential across hundreds of engagements. And the structural characteristics of Tier 1 procurement -- lean teams, proportionally larger spend, more single-sourced categories -- mean the opportunity is often bigger, not smaller, than at the OEM level.
The question isn’t whether the savings exist. It’s whether your procurement process is equipped to find them.
Sources
Magna International 2024 Annual Report / 10-K -- Revenue $42.8B, COGS $37.0B (materials $26.0B, labor $3.1B, overhead $7.9B), net income $1.01B
GM 2024 10-K (SEC Filing) -- Direct materials ~66% of automotive COGS; revenue $187.4B, net income $6.0B
Bain & Company -- Uncovering Major Savings in Procurement -- €31M savings (11% reduction) for industrial manufacturer
McKinsey -- Rapid Procurement Transformation -- 15% bottom-line savings on external spend typical
McKinsey -- Automotive ML Procurement Case -- 10-25% savings via ML; truck manufacturer saved €20M+
BCG -- Cost Competitiveness for Consumer Durables -- $1B+ savings identified; 8-10% per category
Market Realist -- Raw Materials as Cost Driver in Auto Industry -- Raw materials ~47% of vehicle cost
Automotive Logistics -- OEMs Slashing Costs in 2025 -- Industry margin compression context
Frequently Asked Questions
Why is $1 of procurement savings worth more than $1 of new revenue?
Revenue flows through the entire cost structure before reaching profit. At a 2.4% net margin (Magna’s 2024 actual), only 2.4 cents of every revenue dollar reaches the bottom line. A dollar saved in procurement drops entirely to profit with no incremental costs. At 2.4% margins, $1 saved has the same profit impact as $42 of new sales. At 5% margins, it’s $20. The lower the margin, the more dramatic the multiplier.
What percentage of a Tier 1 supplier’s costs are direct materials?
Magna International’s 2024 filing shows direct materials at $26.0 billion out of $37.0 billion in total COGS -- 70% of cost of goods sold and 61% of total revenue. Industry-wide, automotive Tier 1 suppliers typically spend 60-70% of their COGS on purchased materials and components, making procurement the single largest controllable cost line.
How much can procurement savings realistically deliver for a Tier 1 supplier?
Tier-one consulting firms consistently document 10-15% savings on addressed spend through structured procurement programs. Bain achieved 11% for an industrial manufacturer, McKinsey reports 15% as typical, BCG found 8-10% per category, and Brose Group achieved 15% on part procurement costs. These are audited, published results. For a $2 billion Tier 1 at 80% direct spend, 10% savings = $152 million -- equivalent to $3 billion in new sales at 5% margins.
Why do Tier 1 suppliers often have more procurement savings opportunity than OEMs?
Three structural factors: leaner procurement teams relative to spend volume (more categories go unsourced competitively), more single-sourced categories (incumbent pricing hasn’t been market-tested), and higher material-to-revenue ratios (60-70% vs 50-55% at more vertically integrated OEMs). The same savings rate applied to a proportionally larger base, with a higher multiplier from lower margins, generates more relative impact.
How does LightSource help Tier 1 suppliers find 10-15% savings?
LightSource drives savings through competitive visibility across under-sourced categories, AI-assisted specification optimization on BOM data, automated quote normalization for apples-to-apples comparison, historical benchmarking against every prior bid, and cycle-time compression that frees buyers to negotiate rather than administrate. The platform is purpose-built for direct materials procurement -- the 80% of spend where the savings opportunity is largest.
What should a Tier 1 CFO prioritize first?
Start with competitive visibility on your top 20 spend categories by dollar volume. Many of these categories have been single-sourced for years with no market-tested pricing. Running structured competitive events on just the top 20 categories typically surfaces 60-70% of the total savings opportunity. The ROI on procurement technology is typically 5-10x within the first year, with savings flowing directly to EBITDA and net income.
Read more


Read more
Read more
Faster sourcing. Lower cost. Less chaos.
See how LightSource connects engineering, procurement, and suppliers in one operating system to help you launch faster at lower cost.
SOC 2
Kearney #1 2024
Gartner Cool Vendor
Procuretech 100
G2 Top Rated
Faster sourcing. Lower cost. Less chaos.
See how LightSource connects engineering, procurement, and suppliers in one operating system to help you launch faster at lower cost.
SOC 2
Kearney #1 2024
Gartner Cool Vendor
Procuretech 100
G2 Top Rated
Faster sourcing. Lower cost. Less chaos.
See how LightSource connects engineering, procurement, and suppliers in one operating system to help you launch faster at lower cost.
SOC 2
Kearney #1 2024
Gartner Cool Vendor
Procuretech 100
G2 Top Rated
Trusted by:
Trusted by:
Trusted by: