
Every publicly traded company in America has to file a 10-K with the SEC once a year. For foreign-listed companies, the equivalent is a 20-F. These documents are not marketing materials. They’re legal obligations -- signed by the CEO and CFO, reviewed by auditors, and subject to securities fraud liability if they misrepresent material facts. Which makes them, paradoxically, the most honest documents in the auto industry.
We pulled the latest annual filings for seven of the biggest automakers on earth -- General Motors, Ford, Tesla, Toyota, Volkswagen, Stellantis, and Hyundai -- and read them cover to cover. Not the press releases. Not the earnings call transcripts. The actual filings, submitted to the SEC or published as statutory annual reports. What we found is that each company’s filing reads like a strategic fingerprint: the terms they use, the risks they disclose, the numbers they emphasize, and the ones they bury all tell a story about where management is actually placing its bets.
Here’s what we analyzed:
General Motors: 10-K (FY2025, filed January 2026) + 10-Q (Q1 2026)
Ford Motor Company: 10-K (FY2025, filed February 2026) + 10-Q (Q1 2026)
Tesla: 10-K (FY2025, filed January 2026) + 10-Q (Q1 2026)
Toyota Motor Corporation: 20-F (FY2025, ending March 2025) + Financial Summary
Volkswagen Group: 2025 Annual Report (published March 2026)
Stellantis NV: 20-F (FY2025, filed February 2026)
Hyundai Motor Company: 2025 Annual Results + CEO Investor Day Presentation
Between them, these companies sold roughly 43 million vehicles in their most recent fiscal year, generated over $1.4 trillion in combined revenue, and spent more than $80 billion on R&D.
How to Read an OEM Filing Like a Strategy Document
A 10-K is not organized like a strategy deck. The signal is scattered. But if you know where to look, a handful of sections tell you nearly everything:
Segment reporting is where the company admits which businesses make money. Ford’s three-segment structure (Blue, Model e, Pro) is the gold standard for transparency. Most OEMs bury EV economics inside regional or brand-level reporting.
Risk factors are where management names the threats lawyers believe are material. When a risk moves from boilerplate to detailed disclosure, something changed.
R&D and capital expenditure are where ambition becomes cash. A company can say anything on an earnings call; the R&D line tells you what it’s actually funding.
Impairments and restructuring charges are where past strategy gets marked down. An impairment is not just an accounting charge -- it’s a revised view of the future.
Word patterns are not perfect evidence, but they’re a useful signal. When “hybrid” moves from footnote to centerpiece across multiple filings, that’s an industry shift, not a vocabulary preference. When “AI” appears 50 times in one filing and twice in another, management attention is visibly different.
The Financial Fingerprints
Before diving into language and strategy, here’s the baseline:
OEM | Revenue | Op. Margin | R&D Spend | Vehicles Sold | Cash Position |
|---|---|---|---|---|---|
Toyota | $331B (¥48.0T) | 10.0% | $8.7B (¥1,326B) | 9.36M | $62B (¥8.98T) |
VW Group | $350B (€321.9B) | 2.8% (4.6% adj.) | $23.7B (€21.8B) | 9.0M | $37.5B (€34.5B net liq.) |
GM | $185B | ~1.6% | $8.5B | 6.18M | $20.5B |
Ford | $187B | Net loss | ~$8.7B | ~4.4M | $28.7B |
Stellantis | $167B (€153.5B) | -0.5% | N/A disclosed | ~5.5M | Negative FCF |
Hyundai | $128B (KRW 186.3T) | 6.2% | ~$5.1B (KRW 7.4T) | 4.14M | N/A |
Tesla | $94.8B | 4.6% | $6.4B | 1.64M | $44B |
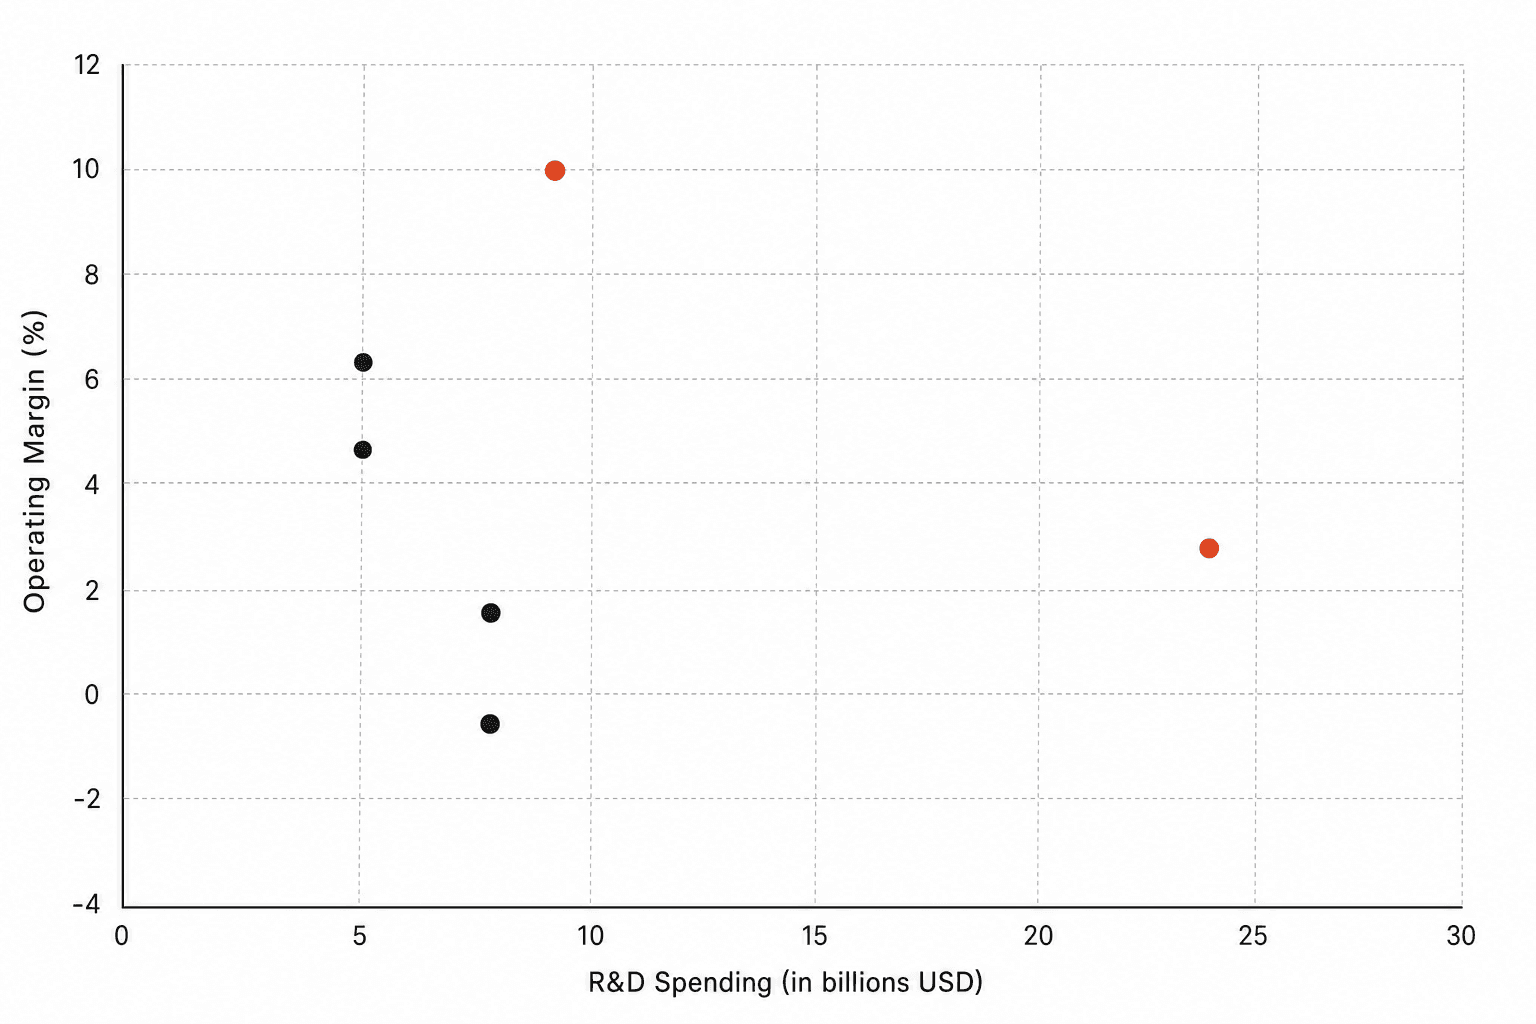
A few things jump out immediately. Toyota is the most profitable major automaker in the world by a wide margin -- its 10% operating margin is more than three times GM’s and nearly four times VW’s adjusted figure. Volkswagen spends more on R&D than any automaker on earth -- $23.7 billion, nearly four times Tesla’s $6.4 billion -- and yet its software division CARIAD is still losing over $2 billion per year. Tesla, the smallest company by vehicle volume, is sitting on $44 billion in cash -- more than any OEM except Toyota.
And then there’s Stellantis, which posted the first annual net loss in the company’s history: negative €22.3 billion, driven by €25.4 billion in write-downs. That write-down is larger than most OEMs’ entire annual operating profit.
The Language Test: What Each Company Talks About
The most revealing thing about a 10-K isn’t what it says -- it’s how often it says it. When a company mentions a term dozens of times in its risk factors and MD&A, that’s where management’s attention actually lives. When a term barely appears, that’s what the company hasn’t prioritized -- regardless of what the CEO says at CES.
US-Headquartered OEMs:
Theme | GM | Ford | Tesla |
|---|---|---|---|
EV / battery | High | High | Core identity |
Hybrid | Moderate | Moderate | Zero |
Software | High | Moderate | Very high |
AI / autonomy | Moderate | Low | Central thesis |
Restructuring | High | Very high | Moderate |
China / tariff | High | Moderate | Moderate |
Commercial / fleet | Moderate | Very high | Low |
Hydrogen | -- | -- | -- |
Robotics | -- | -- | Central |
Energy storage | Low | Low | Central |
Global OEMs:
Theme | Toyota | VW | Stellantis | Hyundai |
|---|---|---|---|---|
EV / battery | Moderate | High | Moderate | High |
Hybrid | Dominant | Moderate | Moderate | Very high |
Software | Low | Very high | Low | Moderate |
AI / autonomy | Low | Moderate | Minimal | Moderate |
Restructuring | Low | Very high | Very high | Low |
China / tariff | Moderate | Very high | Moderate | Moderate |
Commercial / fleet | Moderate | Moderate | Moderate | Moderate |
Hydrogen | Moderate | Low | -- | Moderate |
Robotics | -- | -- | -- | -- |
Energy storage | Low | Low | -- | Low |
Three patterns stand out.
Tesla doesn’t sound like an automaker anymore. Its 10-K reads more like a technology conglomerate’s filing than a car company’s. The words “AI,” “robotics,” “energy storage,” and “autonomous” appear throughout -- and they’re not aspirational footnotes, they’re describing revenue-generating business segments. Tesla’s energy division did $12.8 billion in revenue in FY2025, deployed 46.7 GWh of storage, and launched a Robotaxi service in June 2025. Its R&D spending jumped 41% to $6.4 billion, driven by AI compute infrastructure -- and the 10-K now carries “AI infrastructure” as a $7.7 billion line item on the balance sheet, a category that doesn’t exist on any other OEM’s books. No other OEM’s filing contains the sentence “developing and commercializing AI robots” as a core business description.
VW writes like a company trying to restructure in real time. “Restructuring,” “cost reduction,” and “investment discipline” are everywhere. The filing targets 50,000 job cuts across the group by 2030 -- including 7,500 at Audi, 3,900 at Porsche, and 1,600 CARIAD software engineers (30% of the division) -- with €15 billion in annual savings targeted. CFO Arno Antlitz stated in the annual report that the 4.6% adjusted margin “is not sufficient in the long run.” Porsche -- historically VW’s crown jewel -- posted a 0.3% operating margin, down from approximately 17%. The Rivian and Xpeng software partnerships are, in filing language, an admission that CARIAD’s internal software development failed after billions in investment.
Toyota barely mentions software, AI, or autonomy. Its filings use phrases like “make ever-better cars,” “product-centered and region-centered management,” and “producing happiness for all.” The Toyota Mobility Concept is structured in three stages: Mobility 1.0 (cars to mobility), Mobility 2.0 (expanding access), Mobility 3.0 (mobility and infrastructure working together). The language is deliberately steady -- almost conservative. And yet Toyota posted a 10% operating margin while selling 9.36 million vehicles. The company that talks least like a software company may be the one with the most strategic freedom, because its balance sheet and hybrid economics give it time.
The Risk Factor Reveal
Every 10-K includes a section titled “Risk Factors” -- a legally required disclosure of things that could materially harm the business. When you read seven of them side by side, the differences are telling:
Risk Factor | Who Discloses It | Who Doesn’t |
|---|---|---|
CEO governance/distraction risk | Tesla (Musk’s multi-company roles) | Everyone else |
Software development failure | VW (CARIAD), GM (Cruise impairment) | Toyota, Hyundai |
EV demand uncertainty | GM, Ford, VW, Stellantis | Tesla, Toyota, Hyundai |
Robotaxi regulatory risk | Tesla | Everyone else |
Hydrogen viability | Toyota, Hyundai | GM, Ford, Tesla, VW, Stellantis |
Multi-brand complexity | VW (14+ brands), Stellantis (14+ brands) | Tesla, Toyota, Hyundai |
Leadership transition risk | Stellantis (CEO departure) | Everyone else |
China JV income dependency | GM, VW | Tesla (owns factory), others |
Union labor relations | GM, Ford, Stellantis | Tesla, Toyota, Hyundai (US non-union) |
Ford deserves specific credit for transparency. It’s the only major OEM that breaks its financial reporting into three clearly defined segments -- Ford Blue (ICE and hybrid), Ford Model e (electric), and Ford Pro (commercial) -- each with its own revenue and EBIT disclosure. In FY2025, that transparency revealed Ford Pro generated $66 billion in revenue and $6.8 billion in EBIT with double-digit margins, while Ford Model e lost $4.8 billion ($27,000 per vehicle sold) and took an $8.4 billion impairment charge. Ford also cancelled three planned EVs and ended F-150 Lightning production. A hidden loss is not a smaller loss. Ford’s willingness to show the EV economics may make it look worse in some comparisons, but it also creates internal accountability other OEMs don’t have.
Stellantis disclosed something no other OEM had to: it lost its CEO. Carlos Tavares departed in December 2024, and the FY2025 filing describes a “renewed leadership team” executing a “strategic reset.” The €25.4 billion in write-downs -- classified as “resetting the product plan and EV supply chain to reflect customer demand” -- is the filing equivalent of admitting the previous strategy was wrong. The words “customer preferences and freedom-of-choice” appear repeatedly, which is not filler. It signals a move away from the rigidly cost-optimized, product-push model Tavares was known for.
The Strategic DNA Stoplight Grid
Based on what the filings actually say -- not press releases or CES keynotes:
US-Headquartered OEMs:
Dimension | GM | Ford | Tesla |
|---|---|---|---|
Financial resilience | 🟡 | 🟡 | 🟢 |
EV economics | 🟡 | 🔴 | 🟢 |
Software / SDV | 🟡 | 🟡 | 🟢 |
Autonomous driving | 🟡 | 🔴 | 🟢 |
Powertrain flexibility | 🟢 | 🟢 | 🔴 |
China positioning | 🟡 | 🟡 | 🟢 |
Tariff preparedness | 🟡 | 🟡 | 🟡 |
Cost discipline | 🟡 | 🟡 | 🟢 |
R&D intensity | 🟢 | 🟡 | 🟡 |
New business diversification | 🟡 | 🟡 | 🟢 |
Global OEMs:
Dimension | Toyota | VW | Stellantis | Hyundai |
|---|---|---|---|---|
Financial resilience | 🟢 | 🟡 | 🔴 | 🟢 |
EV economics | 🟡 | 🟡 | 🔴 | 🟢 |
Software / SDV | 🔴 | 🔴 | 🔴 | 🟡 |
Autonomous driving | 🟡 | 🟡 | 🔴 | 🟡 |
Powertrain flexibility | 🟢 | 🟡 | 🟢 | 🟢 |
China positioning | 🟢 | 🔴 | 🔴 | 🟡 |
Tariff preparedness | 🟡 | 🔴 | 🟡 | 🟢 |
Cost discipline | 🟢 | 🟡 | 🔴 | 🟢 |
R&D intensity | 🟢 | 🟢 | 🟡 | 🟡 |
New business diversification | 🟡 | 🟡 | 🔴 | 🟡 |
🟢 Strong 🟡 Moderate 🔴 Limited
The grid reveals four distinct operating archetypes:
The Technology Pivot (Tesla): Green across software, autonomy, and new business -- but it’s a fundamentally different kind of company now. Its 10-K describes a business that makes cars, stores energy, deploys autonomous taxis, and builds humanoid robots. The most important growth line in Tesla’s filing may not be vehicles. It may be energy deployment: in a year when auto revenue was pressured, energy grew 114%.
The Operational Fortress (Toyota, Hyundai): Strong on financial health, cost discipline, and pragmatic electrification. Toyota’s multi-pathway approach -- hybrids today, BEVs when cost-effective, hydrogen for long-haul -- is reflected in stable margins and enormous cash reserves. Hyundai’s “flexible powertrain strategy” mirrors Toyota’s but with a more aggressive electrification timeline (60% electrified by 2030, 18+ hybrid models, EREVs from 2027). Both companies conspicuously avoid software hype. Neither shows up red on cost discipline or financial resilience.
The Struggling Transition (GM, Ford, VW): These are the companies that committed to massive EV investments -- GM’s $35 billion through 2025, Ford’s Model e segment, VW’s €73 billion five-year plan -- and are absorbing the cost. Margins are compressed, impairments are accumulating, and the filings are full of “realignment,” “restructuring,” and “cost reduction.” GM’s $7.9 billion in EV strategic realignment charges (plus the earlier Cruise pivot), Ford’s $13.8 billion in Q4 EV-related charges, and VW’s CARIAD losses plus Porsche margin collapse all represent revised views of the future.

The Crisis (Stellantis): A company in genuine distress. The filing reads like a turnaround document: new leadership, €25.4 billion in write-downs, product plan reset, and repeated emphasis on “customer preferences” that suggests the prior leadership ignored them. The $13 billion US investment commitment is forward-looking, but the filing itself is still processing what went wrong.
The Counter-Intuitive Details
Each filing contains at least one detail that complicates the easy narrative:
OEM | Detail | Why It Matters |
|---|---|---|
GM | Took $7.9B in EV realignment charges while simultaneously investing $1B in V8 engine production and spending $6B on share buybacks | GM is walking back EV bets, protecting ICE profit pools, and returning cash to shareholders -- all in the same year |
Ford | Model e lost $27,000 per vehicle; Ford cancelled 3 EVs and ended F-150 Lightning production | Ford’s segment transparency makes EV pain visible -- but it also led to faster course-correction than OEMs still hiding losses |
Tesla | Energy revenue ($12.8B, 39.5% gross margin in Q1 2026) grew while auto revenue declined; “AI infrastructure” is now a $7.7B balance sheet line item | The company’s growth identity is expanding beyond vehicles in the actual numbers -- and it’s guiding CapEx >$25B for 2026, mostly for AI compute |
Toyota | Lowest software rhetoric, highest operating margin | Raises the uncomfortable question of whether narrative intensity is overrated |
VW | Spends $23.7B on R&D -- more than any OEM -- yet CARIAD still loses $2.2B | R&D spend is an input, not a result. The question is conversion, not volume. |
Stellantis | €25.4B write-down larger than most OEMs’ total annual operating profit | This isn’t a bad quarter. It’s a strategic admission that the product plan was wrong. |
Hyundai | 635,000 hybrids sold (vs. 275,000 EVs) with overall 6.2% margin | The company betting most heavily on powertrain flexibility is also the one with the most balanced financial results |
Five Cross-OEM Lessons From the Filings
1. EV strategy has fractured into at least five strategies. Tesla treats EVs as part of an AI-energy-robotics system. Ford separates EV losses for accountability. GM hedges with truck profits. Toyota and Hyundai lead with hybrids. VW and Stellantis are in EV-related restructuring. The industry didn’t abandon EVs -- it abandoned the idea that adoption would move in a straight line.
2. Hybrids are no longer a bridge -- they’re a profit tool. Toyota and Hyundai make this clearest. Hyundai sold 635,000 hybrids in FY2025, up 27.9%, with record market share of 15.3%. Hybrids address charging infrastructure gaps, battery cost volatility, consumer affordability concerns, tariff uncertainty, and emissions compliance pressure simultaneously. The filings treat hybrids as strategic architecture, not a delay tactic.
3. Impairments are strategy written in accounting ink. GM’s Cruise charge says robotaxi timing changed. Ford’s Model e pressure says EV unit economics changed. Stellantis’s write-downs say prior product assumptions didn’t match the market. VW’s CARIAD restructuring says internal software execution fell short. An impairment is a revised view of the future, and FY2025 produced a lot of revised views.
4. R&D spend is not destiny. VW’s $23.7 billion R&D budget is nearly five times Tesla’s. But VW’s software division is being restructured, its margin is under 3%, and it’s turning to Rivian and Xpeng for architecture it couldn’t build internally. Meanwhile, Toyota spends $8.7 billion and posts a 10% margin. The question isn’t who spends the most -- it’s who converts engineering spend into products, margins, and market position.
5. China is both market and structural competitor. The filings show China in two roles. For GM and VW, China is a market where joint ventures and pricing pressure are reducing profitability -- VW saw China deliveries drop 6%, GM’s JV equity income has been declining for years. For the industry as a whole, Chinese OEM exports (approximately 3 million vehicles annually to Europe and emerging markets) create pressure in segments where Western OEMs have relied on pricing power. China is no longer just growth exposure in the risk factors. It’s a structural competitive force.
What This Means for Procurement and Supply Chain Leaders
If you’re a procurement leader or supplier reading this, the filings tell you something specific about the companies you’re selling to or buying from. Understanding supplier relationship dynamics starts with knowing what your customer’s balance sheet looks like.
An OEM whose filing is dominated by “restructuring” and “cost reduction” is going to squeeze suppliers harder. VW’s and Stellantis’s filings are practically telegraphing procurement pressure -- a dynamic the 2026 Working Relations Index already captured from the supplier side. When VW’s CFO says the current margin “is not sufficient,” every supplier in VW’s supply base should hear that as a warning.
An OEM emphasizing “software” and “AI” needs different suppliers -- or different capabilities from existing ones. Tesla’s supply chain already looks more like a tech company’s than an automaker’s: semiconductor suppliers, compute hardware, battery chemistry partners, and AI training infrastructure.
An OEM with high cash reserves and stable margins -- Toyota, Hyundai -- is likely to be a more predictable customer for direct materials suppliers. Their filings don’t show the wild swings in product strategy that create chaos for supplier quote pipelines.
And an OEM posting massive write-downs and negative free cash flow is a customer whose purchase orders carry more risk than they did two years ago. The filings don’t just tell you about the OEM’s strategy. They tell you about the reliability of your own revenue forecast.
A Caveat Worth Taking Seriously
The biggest objection to this exercise is fair: 10-Ks and 20-Fs are compliance documents, not operating plans. They’re backward-looking, conservative, and shaped by legal risk. Word frequency can mislead -- “battery” may appear often because of supply-risk disclosure, not because of strategic conviction. A company may mention “software” rarely because it treats software as embedded engineering rather than a separate narrative.
So filings should not be read alone. But they’re valuable because they create a floor of seriousness. A CEO can float a vision on stage. A 10-K must reconcile ambition with impairment charges, capital commitments, segment losses, tariffs, restructuring, and cash.
The 10-K is the one document where the CEO can’t spin. The numbers have to add up. The risks have to be disclosed. And the language, if you read it carefully enough, tells you where the company is actually going -- not where the marketing says it’s going.
Sources
General Motors 10-K FY2025 -- SEC EDGAR annual filing
Ford Motor Company 10-K FY2025 -- SEC EDGAR annual filing
Tesla 10-K FY2025 -- SEC EDGAR annual filing
Toyota 20-F FY2025 -- SEC EDGAR annual filing
Toyota FY2025 Financial Summary -- Consolidated results
Volkswagen Group 2025 Annual Report -- Full-year results
VW Group 2025 Press Release -- Financial details
Stellantis FY2025 Results -- Net loss and strategic reset
Stellantis 20-F FY2025 -- SEC EDGAR annual filing
Hyundai Motor 2025 Annual Results -- Revenue, margins, electrification
Hyundai CEO Investor Day 2025 -- 2030 roadmap
PwC Automotive Outlook 2026 -- Industry analysis
S&P Global Automotive Trends 2026 -- Market overview
BCG 2026 Automotive Supplier Study -- Supplier dynamics
Frequently Asked Questions
What is a 10-K filing and why does it matter for understanding OEM strategy?
A 10-K is the annual report that US-listed companies must file with the Securities and Exchange Commission. Unlike press releases, a 10-K is a legal document -- the CEO and CFO personally certify its accuracy, and misstatements can lead to securities fraud charges. Foreign-listed automakers file an equivalent 20-F form. These filings are the most reliable source for understanding a company’s actual financial position, strategic priorities, and risk perception because the consequences for misrepresentation are real.
Which automotive OEM spends the most on R&D?
Volkswagen Group leads all automakers globally with approximately $23.7 billion (€21.8 billion) in R&D spending for FY2025, more than double its nearest competitor. Toyota spends roughly $8.7 billion, GM approximately $8.5 billion, and Ford around $8 billion. Tesla spends $6.4 billion on R&D -- though on a per-vehicle basis, Tesla’s R&D intensity is significantly higher. VW’s case is instructive: the largest R&D budget hasn’t prevented software execution issues at CARIAD or the need for external partnerships with Rivian and Xpeng.
Why does Ford’s 10-K get credit for EV transparency?
Ford is the only major OEM that breaks out its financial results into Ford Blue (ICE and hybrid), Ford Model e (electric), and Ford Pro (commercial) -- each with separate revenue and EBIT disclosure. This makes Ford Model e’s $4.8 billion EBIT loss clearly visible while also showing that Ford Pro is a $66 billion business with $6.8 billion in EBIT. Other OEMs bury equivalent EV losses within broader segments, which can obscure the true cost of the electrification transition.
How does reading 10-K risk factors help predict supplier relationships?
An OEM whose filing emphasizes “restructuring,” “cost reduction,” and margin pressure -- like VW (whose CFO called the current margin “not sufficient”) or Stellantis (€25.4 billion in write-downs) -- is likely to intensify procurement negotiations and squeeze supplier margins. Conversely, OEMs with stable margins and high cash reserves (Toyota at 10% operating margin and $62 billion in cash, Hyundai at 6.2% margin) tend to be more predictable customers. Reading the risk factors of your customers’ filings tells you about the reliability of your own revenue forecast.
What is the most surprising finding from comparing these seven OEM filings?
The most counter-intuitive finding is that the company spending the least time talking about software and AI -- Toyota -- has the highest operating margin (10%) and the largest cash reserves ($62 billion) of any major automaker. Meanwhile, the company spending the most on R&D -- Volkswagen at $23.7 billion -- has a 2.8% operating margin and is cutting 50,000 jobs and is restructuring its software division after years of losses. This suggests that narrative intensity around technology trends does not correlate with financial performance, at least not in the near term.
Are hydrogen fuel cells still relevant based on what OEM filings disclose?
Hydrogen appears as a meaningful strategic theme in only two of the seven filings: Toyota (part of its multi-pathway electrification strategy) and Hyundai (which lists “H2 Solution” as one of three strategic pillars). For GM, Ford, Tesla, VW, and Stellantis, hydrogen has effectively disappeared from the regulatory filings -- a quiet industry concession that battery electric has won the near-term argument for passenger vehicles, even if hydrogen may retain a role in heavy-duty transport.
Every publicly traded company in America has to file a 10-K with the SEC once a year. For foreign-listed companies, the equivalent is a 20-F. These documents are not marketing materials. They’re legal obligations -- signed by the CEO and CFO, reviewed by auditors, and subject to securities fraud liability if they misrepresent material facts. Which makes them, paradoxically, the most honest documents in the auto industry.
We pulled the latest annual filings for seven of the biggest automakers on earth -- General Motors, Ford, Tesla, Toyota, Volkswagen, Stellantis, and Hyundai -- and read them cover to cover. Not the press releases. Not the earnings call transcripts. The actual filings, submitted to the SEC or published as statutory annual reports. What we found is that each company’s filing reads like a strategic fingerprint: the terms they use, the risks they disclose, the numbers they emphasize, and the ones they bury all tell a story about where management is actually placing its bets.
Here’s what we analyzed:
General Motors: 10-K (FY2025, filed January 2026) + 10-Q (Q1 2026)
Ford Motor Company: 10-K (FY2025, filed February 2026) + 10-Q (Q1 2026)
Tesla: 10-K (FY2025, filed January 2026) + 10-Q (Q1 2026)
Toyota Motor Corporation: 20-F (FY2025, ending March 2025) + Financial Summary
Volkswagen Group: 2025 Annual Report (published March 2026)
Stellantis NV: 20-F (FY2025, filed February 2026)
Hyundai Motor Company: 2025 Annual Results + CEO Investor Day Presentation
Between them, these companies sold roughly 43 million vehicles in their most recent fiscal year, generated over $1.4 trillion in combined revenue, and spent more than $80 billion on R&D.
How to Read an OEM Filing Like a Strategy Document
A 10-K is not organized like a strategy deck. The signal is scattered. But if you know where to look, a handful of sections tell you nearly everything:
Segment reporting is where the company admits which businesses make money. Ford’s three-segment structure (Blue, Model e, Pro) is the gold standard for transparency. Most OEMs bury EV economics inside regional or brand-level reporting.
Risk factors are where management names the threats lawyers believe are material. When a risk moves from boilerplate to detailed disclosure, something changed.
R&D and capital expenditure are where ambition becomes cash. A company can say anything on an earnings call; the R&D line tells you what it’s actually funding.
Impairments and restructuring charges are where past strategy gets marked down. An impairment is not just an accounting charge -- it’s a revised view of the future.
Word patterns are not perfect evidence, but they’re a useful signal. When “hybrid” moves from footnote to centerpiece across multiple filings, that’s an industry shift, not a vocabulary preference. When “AI” appears 50 times in one filing and twice in another, management attention is visibly different.
The Financial Fingerprints
Before diving into language and strategy, here’s the baseline:
OEM | Revenue | Op. Margin | R&D Spend | Vehicles Sold | Cash Position |
|---|---|---|---|---|---|
Toyota | $331B (¥48.0T) | 10.0% | $8.7B (¥1,326B) | 9.36M | $62B (¥8.98T) |
VW Group | $350B (€321.9B) | 2.8% (4.6% adj.) | $23.7B (€21.8B) | 9.0M | $37.5B (€34.5B net liq.) |
GM | $185B | ~1.6% | $8.5B | 6.18M | $20.5B |
Ford | $187B | Net loss | ~$8.7B | ~4.4M | $28.7B |
Stellantis | $167B (€153.5B) | -0.5% | N/A disclosed | ~5.5M | Negative FCF |
Hyundai | $128B (KRW 186.3T) | 6.2% | ~$5.1B (KRW 7.4T) | 4.14M | N/A |
Tesla | $94.8B | 4.6% | $6.4B | 1.64M | $44B |
A few things jump out immediately. Toyota is the most profitable major automaker in the world by a wide margin -- its 10% operating margin is more than three times GM’s and nearly four times VW’s adjusted figure. Volkswagen spends more on R&D than any automaker on earth -- $23.7 billion, nearly four times Tesla’s $6.4 billion -- and yet its software division CARIAD is still losing over $2 billion per year. Tesla, the smallest company by vehicle volume, is sitting on $44 billion in cash -- more than any OEM except Toyota.
And then there’s Stellantis, which posted the first annual net loss in the company’s history: negative €22.3 billion, driven by €25.4 billion in write-downs. That write-down is larger than most OEMs’ entire annual operating profit.
The Language Test: What Each Company Talks About
The most revealing thing about a 10-K isn’t what it says -- it’s how often it says it. When a company mentions a term dozens of times in its risk factors and MD&A, that’s where management’s attention actually lives. When a term barely appears, that’s what the company hasn’t prioritized -- regardless of what the CEO says at CES.
US-Headquartered OEMs:
Theme | GM | Ford | Tesla |
|---|---|---|---|
EV / battery | High | High | Core identity |
Hybrid | Moderate | Moderate | Zero |
Software | High | Moderate | Very high |
AI / autonomy | Moderate | Low | Central thesis |
Restructuring | High | Very high | Moderate |
China / tariff | High | Moderate | Moderate |
Commercial / fleet | Moderate | Very high | Low |
Hydrogen | -- | -- | -- |
Robotics | -- | -- | Central |
Energy storage | Low | Low | Central |
Global OEMs:
Theme | Toyota | VW | Stellantis | Hyundai |
|---|---|---|---|---|
EV / battery | Moderate | High | Moderate | High |
Hybrid | Dominant | Moderate | Moderate | Very high |
Software | Low | Very high | Low | Moderate |
AI / autonomy | Low | Moderate | Minimal | Moderate |
Restructuring | Low | Very high | Very high | Low |
China / tariff | Moderate | Very high | Moderate | Moderate |
Commercial / fleet | Moderate | Moderate | Moderate | Moderate |
Hydrogen | Moderate | Low | -- | Moderate |
Robotics | -- | -- | -- | -- |
Energy storage | Low | Low | -- | Low |
Three patterns stand out.
Tesla doesn’t sound like an automaker anymore. Its 10-K reads more like a technology conglomerate’s filing than a car company’s. The words “AI,” “robotics,” “energy storage,” and “autonomous” appear throughout -- and they’re not aspirational footnotes, they’re describing revenue-generating business segments. Tesla’s energy division did $12.8 billion in revenue in FY2025, deployed 46.7 GWh of storage, and launched a Robotaxi service in June 2025. Its R&D spending jumped 41% to $6.4 billion, driven by AI compute infrastructure -- and the 10-K now carries “AI infrastructure” as a $7.7 billion line item on the balance sheet, a category that doesn’t exist on any other OEM’s books. No other OEM’s filing contains the sentence “developing and commercializing AI robots” as a core business description.
VW writes like a company trying to restructure in real time. “Restructuring,” “cost reduction,” and “investment discipline” are everywhere. The filing targets 50,000 job cuts across the group by 2030 -- including 7,500 at Audi, 3,900 at Porsche, and 1,600 CARIAD software engineers (30% of the division) -- with €15 billion in annual savings targeted. CFO Arno Antlitz stated in the annual report that the 4.6% adjusted margin “is not sufficient in the long run.” Porsche -- historically VW’s crown jewel -- posted a 0.3% operating margin, down from approximately 17%. The Rivian and Xpeng software partnerships are, in filing language, an admission that CARIAD’s internal software development failed after billions in investment.
Toyota barely mentions software, AI, or autonomy. Its filings use phrases like “make ever-better cars,” “product-centered and region-centered management,” and “producing happiness for all.” The Toyota Mobility Concept is structured in three stages: Mobility 1.0 (cars to mobility), Mobility 2.0 (expanding access), Mobility 3.0 (mobility and infrastructure working together). The language is deliberately steady -- almost conservative. And yet Toyota posted a 10% operating margin while selling 9.36 million vehicles. The company that talks least like a software company may be the one with the most strategic freedom, because its balance sheet and hybrid economics give it time.
The Risk Factor Reveal
Every 10-K includes a section titled “Risk Factors” -- a legally required disclosure of things that could materially harm the business. When you read seven of them side by side, the differences are telling:
Risk Factor | Who Discloses It | Who Doesn’t |
|---|---|---|
CEO governance/distraction risk | Tesla (Musk’s multi-company roles) | Everyone else |
Software development failure | VW (CARIAD), GM (Cruise impairment) | Toyota, Hyundai |
EV demand uncertainty | GM, Ford, VW, Stellantis | Tesla, Toyota, Hyundai |
Robotaxi regulatory risk | Tesla | Everyone else |
Hydrogen viability | Toyota, Hyundai | GM, Ford, Tesla, VW, Stellantis |
Multi-brand complexity | VW (14+ brands), Stellantis (14+ brands) | Tesla, Toyota, Hyundai |
Leadership transition risk | Stellantis (CEO departure) | Everyone else |
China JV income dependency | GM, VW | Tesla (owns factory), others |
Union labor relations | GM, Ford, Stellantis | Tesla, Toyota, Hyundai (US non-union) |
Ford deserves specific credit for transparency. It’s the only major OEM that breaks its financial reporting into three clearly defined segments -- Ford Blue (ICE and hybrid), Ford Model e (electric), and Ford Pro (commercial) -- each with its own revenue and EBIT disclosure. In FY2025, that transparency revealed Ford Pro generated $66 billion in revenue and $6.8 billion in EBIT with double-digit margins, while Ford Model e lost $4.8 billion ($27,000 per vehicle sold) and took an $8.4 billion impairment charge. Ford also cancelled three planned EVs and ended F-150 Lightning production. A hidden loss is not a smaller loss. Ford’s willingness to show the EV economics may make it look worse in some comparisons, but it also creates internal accountability other OEMs don’t have.
Stellantis disclosed something no other OEM had to: it lost its CEO. Carlos Tavares departed in December 2024, and the FY2025 filing describes a “renewed leadership team” executing a “strategic reset.” The €25.4 billion in write-downs -- classified as “resetting the product plan and EV supply chain to reflect customer demand” -- is the filing equivalent of admitting the previous strategy was wrong. The words “customer preferences and freedom-of-choice” appear repeatedly, which is not filler. It signals a move away from the rigidly cost-optimized, product-push model Tavares was known for.
The Strategic DNA Stoplight Grid
Based on what the filings actually say -- not press releases or CES keynotes:
US-Headquartered OEMs:
Dimension | GM | Ford | Tesla |
|---|---|---|---|
Financial resilience | 🟡 | 🟡 | 🟢 |
EV economics | 🟡 | 🔴 | 🟢 |
Software / SDV | 🟡 | 🟡 | 🟢 |
Autonomous driving | 🟡 | 🔴 | 🟢 |
Powertrain flexibility | 🟢 | 🟢 | 🔴 |
China positioning | 🟡 | 🟡 | 🟢 |
Tariff preparedness | 🟡 | 🟡 | 🟡 |
Cost discipline | 🟡 | 🟡 | 🟢 |
R&D intensity | 🟢 | 🟡 | 🟡 |
New business diversification | 🟡 | 🟡 | 🟢 |
Global OEMs:
Dimension | Toyota | VW | Stellantis | Hyundai |
|---|---|---|---|---|
Financial resilience | 🟢 | 🟡 | 🔴 | 🟢 |
EV economics | 🟡 | 🟡 | 🔴 | 🟢 |
Software / SDV | 🔴 | 🔴 | 🔴 | 🟡 |
Autonomous driving | 🟡 | 🟡 | 🔴 | 🟡 |
Powertrain flexibility | 🟢 | 🟡 | 🟢 | 🟢 |
China positioning | 🟢 | 🔴 | 🔴 | 🟡 |
Tariff preparedness | 🟡 | 🔴 | 🟡 | 🟢 |
Cost discipline | 🟢 | 🟡 | 🔴 | 🟢 |
R&D intensity | 🟢 | 🟢 | 🟡 | 🟡 |
New business diversification | 🟡 | 🟡 | 🔴 | 🟡 |
🟢 Strong 🟡 Moderate 🔴 Limited
The grid reveals four distinct operating archetypes:
The Technology Pivot (Tesla): Green across software, autonomy, and new business -- but it’s a fundamentally different kind of company now. Its 10-K describes a business that makes cars, stores energy, deploys autonomous taxis, and builds humanoid robots. The most important growth line in Tesla’s filing may not be vehicles. It may be energy deployment: in a year when auto revenue was pressured, energy grew 114%.
The Operational Fortress (Toyota, Hyundai): Strong on financial health, cost discipline, and pragmatic electrification. Toyota’s multi-pathway approach -- hybrids today, BEVs when cost-effective, hydrogen for long-haul -- is reflected in stable margins and enormous cash reserves. Hyundai’s “flexible powertrain strategy” mirrors Toyota’s but with a more aggressive electrification timeline (60% electrified by 2030, 18+ hybrid models, EREVs from 2027). Both companies conspicuously avoid software hype. Neither shows up red on cost discipline or financial resilience.
The Struggling Transition (GM, Ford, VW): These are the companies that committed to massive EV investments -- GM’s $35 billion through 2025, Ford’s Model e segment, VW’s €73 billion five-year plan -- and are absorbing the cost. Margins are compressed, impairments are accumulating, and the filings are full of “realignment,” “restructuring,” and “cost reduction.” GM’s $7.9 billion in EV strategic realignment charges (plus the earlier Cruise pivot), Ford’s $13.8 billion in Q4 EV-related charges, and VW’s CARIAD losses plus Porsche margin collapse all represent revised views of the future.
The Crisis (Stellantis): A company in genuine distress. The filing reads like a turnaround document: new leadership, €25.4 billion in write-downs, product plan reset, and repeated emphasis on “customer preferences” that suggests the prior leadership ignored them. The $13 billion US investment commitment is forward-looking, but the filing itself is still processing what went wrong.
The Counter-Intuitive Details
Each filing contains at least one detail that complicates the easy narrative:
OEM | Detail | Why It Matters |
|---|---|---|
GM | Took $7.9B in EV realignment charges while simultaneously investing $1B in V8 engine production and spending $6B on share buybacks | GM is walking back EV bets, protecting ICE profit pools, and returning cash to shareholders -- all in the same year |
Ford | Model e lost $27,000 per vehicle; Ford cancelled 3 EVs and ended F-150 Lightning production | Ford’s segment transparency makes EV pain visible -- but it also led to faster course-correction than OEMs still hiding losses |
Tesla | Energy revenue ($12.8B, 39.5% gross margin in Q1 2026) grew while auto revenue declined; “AI infrastructure” is now a $7.7B balance sheet line item | The company’s growth identity is expanding beyond vehicles in the actual numbers -- and it’s guiding CapEx >$25B for 2026, mostly for AI compute |
Toyota | Lowest software rhetoric, highest operating margin | Raises the uncomfortable question of whether narrative intensity is overrated |
VW | Spends $23.7B on R&D -- more than any OEM -- yet CARIAD still loses $2.2B | R&D spend is an input, not a result. The question is conversion, not volume. |
Stellantis | €25.4B write-down larger than most OEMs’ total annual operating profit | This isn’t a bad quarter. It’s a strategic admission that the product plan was wrong. |
Hyundai | 635,000 hybrids sold (vs. 275,000 EVs) with overall 6.2% margin | The company betting most heavily on powertrain flexibility is also the one with the most balanced financial results |
Five Cross-OEM Lessons From the Filings
1. EV strategy has fractured into at least five strategies. Tesla treats EVs as part of an AI-energy-robotics system. Ford separates EV losses for accountability. GM hedges with truck profits. Toyota and Hyundai lead with hybrids. VW and Stellantis are in EV-related restructuring. The industry didn’t abandon EVs -- it abandoned the idea that adoption would move in a straight line.
2. Hybrids are no longer a bridge -- they’re a profit tool. Toyota and Hyundai make this clearest. Hyundai sold 635,000 hybrids in FY2025, up 27.9%, with record market share of 15.3%. Hybrids address charging infrastructure gaps, battery cost volatility, consumer affordability concerns, tariff uncertainty, and emissions compliance pressure simultaneously. The filings treat hybrids as strategic architecture, not a delay tactic.
3. Impairments are strategy written in accounting ink. GM’s Cruise charge says robotaxi timing changed. Ford’s Model e pressure says EV unit economics changed. Stellantis’s write-downs say prior product assumptions didn’t match the market. VW’s CARIAD restructuring says internal software execution fell short. An impairment is a revised view of the future, and FY2025 produced a lot of revised views.
4. R&D spend is not destiny. VW’s $23.7 billion R&D budget is nearly five times Tesla’s. But VW’s software division is being restructured, its margin is under 3%, and it’s turning to Rivian and Xpeng for architecture it couldn’t build internally. Meanwhile, Toyota spends $8.7 billion and posts a 10% margin. The question isn’t who spends the most -- it’s who converts engineering spend into products, margins, and market position.
5. China is both market and structural competitor. The filings show China in two roles. For GM and VW, China is a market where joint ventures and pricing pressure are reducing profitability -- VW saw China deliveries drop 6%, GM’s JV equity income has been declining for years. For the industry as a whole, Chinese OEM exports (approximately 3 million vehicles annually to Europe and emerging markets) create pressure in segments where Western OEMs have relied on pricing power. China is no longer just growth exposure in the risk factors. It’s a structural competitive force.
What This Means for Procurement and Supply Chain Leaders
If you’re a procurement leader or supplier reading this, the filings tell you something specific about the companies you’re selling to or buying from. Understanding supplier relationship dynamics starts with knowing what your customer’s balance sheet looks like.
An OEM whose filing is dominated by “restructuring” and “cost reduction” is going to squeeze suppliers harder. VW’s and Stellantis’s filings are practically telegraphing procurement pressure -- a dynamic the 2026 Working Relations Index already captured from the supplier side. When VW’s CFO says the current margin “is not sufficient,” every supplier in VW’s supply base should hear that as a warning.
An OEM emphasizing “software” and “AI” needs different suppliers -- or different capabilities from existing ones. Tesla’s supply chain already looks more like a tech company’s than an automaker’s: semiconductor suppliers, compute hardware, battery chemistry partners, and AI training infrastructure.
An OEM with high cash reserves and stable margins -- Toyota, Hyundai -- is likely to be a more predictable customer for direct materials suppliers. Their filings don’t show the wild swings in product strategy that create chaos for supplier quote pipelines.
And an OEM posting massive write-downs and negative free cash flow is a customer whose purchase orders carry more risk than they did two years ago. The filings don’t just tell you about the OEM’s strategy. They tell you about the reliability of your own revenue forecast.
A Caveat Worth Taking Seriously
The biggest objection to this exercise is fair: 10-Ks and 20-Fs are compliance documents, not operating plans. They’re backward-looking, conservative, and shaped by legal risk. Word frequency can mislead -- “battery” may appear often because of supply-risk disclosure, not because of strategic conviction. A company may mention “software” rarely because it treats software as embedded engineering rather than a separate narrative.
So filings should not be read alone. But they’re valuable because they create a floor of seriousness. A CEO can float a vision on stage. A 10-K must reconcile ambition with impairment charges, capital commitments, segment losses, tariffs, restructuring, and cash.
The 10-K is the one document where the CEO can’t spin. The numbers have to add up. The risks have to be disclosed. And the language, if you read it carefully enough, tells you where the company is actually going -- not where the marketing says it’s going.
Sources
General Motors 10-K FY2025 -- SEC EDGAR annual filing
Ford Motor Company 10-K FY2025 -- SEC EDGAR annual filing
Tesla 10-K FY2025 -- SEC EDGAR annual filing
Toyota 20-F FY2025 -- SEC EDGAR annual filing
Toyota FY2025 Financial Summary -- Consolidated results
Volkswagen Group 2025 Annual Report -- Full-year results
VW Group 2025 Press Release -- Financial details
Stellantis FY2025 Results -- Net loss and strategic reset
Stellantis 20-F FY2025 -- SEC EDGAR annual filing
Hyundai Motor 2025 Annual Results -- Revenue, margins, electrification
Hyundai CEO Investor Day 2025 -- 2030 roadmap
PwC Automotive Outlook 2026 -- Industry analysis
S&P Global Automotive Trends 2026 -- Market overview
BCG 2026 Automotive Supplier Study -- Supplier dynamics
Frequently Asked Questions
What is a 10-K filing and why does it matter for understanding OEM strategy?
A 10-K is the annual report that US-listed companies must file with the Securities and Exchange Commission. Unlike press releases, a 10-K is a legal document -- the CEO and CFO personally certify its accuracy, and misstatements can lead to securities fraud charges. Foreign-listed automakers file an equivalent 20-F form. These filings are the most reliable source for understanding a company’s actual financial position, strategic priorities, and risk perception because the consequences for misrepresentation are real.
Which automotive OEM spends the most on R&D?
Volkswagen Group leads all automakers globally with approximately $23.7 billion (€21.8 billion) in R&D spending for FY2025, more than double its nearest competitor. Toyota spends roughly $8.7 billion, GM approximately $8.5 billion, and Ford around $8 billion. Tesla spends $6.4 billion on R&D -- though on a per-vehicle basis, Tesla’s R&D intensity is significantly higher. VW’s case is instructive: the largest R&D budget hasn’t prevented software execution issues at CARIAD or the need for external partnerships with Rivian and Xpeng.
Why does Ford’s 10-K get credit for EV transparency?
Ford is the only major OEM that breaks out its financial results into Ford Blue (ICE and hybrid), Ford Model e (electric), and Ford Pro (commercial) -- each with separate revenue and EBIT disclosure. This makes Ford Model e’s $4.8 billion EBIT loss clearly visible while also showing that Ford Pro is a $66 billion business with $6.8 billion in EBIT. Other OEMs bury equivalent EV losses within broader segments, which can obscure the true cost of the electrification transition.
How does reading 10-K risk factors help predict supplier relationships?
An OEM whose filing emphasizes “restructuring,” “cost reduction,” and margin pressure -- like VW (whose CFO called the current margin “not sufficient”) or Stellantis (€25.4 billion in write-downs) -- is likely to intensify procurement negotiations and squeeze supplier margins. Conversely, OEMs with stable margins and high cash reserves (Toyota at 10% operating margin and $62 billion in cash, Hyundai at 6.2% margin) tend to be more predictable customers. Reading the risk factors of your customers’ filings tells you about the reliability of your own revenue forecast.
What is the most surprising finding from comparing these seven OEM filings?
The most counter-intuitive finding is that the company spending the least time talking about software and AI -- Toyota -- has the highest operating margin (10%) and the largest cash reserves ($62 billion) of any major automaker. Meanwhile, the company spending the most on R&D -- Volkswagen at $23.7 billion -- has a 2.8% operating margin and is cutting 50,000 jobs and is restructuring its software division after years of losses. This suggests that narrative intensity around technology trends does not correlate with financial performance, at least not in the near term.
Are hydrogen fuel cells still relevant based on what OEM filings disclose?
Hydrogen appears as a meaningful strategic theme in only two of the seven filings: Toyota (part of its multi-pathway electrification strategy) and Hyundai (which lists “H2 Solution” as one of three strategic pillars). For GM, Ford, Tesla, VW, and Stellantis, hydrogen has effectively disappeared from the regulatory filings -- a quiet industry concession that battery electric has won the near-term argument for passenger vehicles, even if hydrogen may retain a role in heavy-duty transport.
Every publicly traded company in America has to file a 10-K with the SEC once a year. For foreign-listed companies, the equivalent is a 20-F. These documents are not marketing materials. They’re legal obligations -- signed by the CEO and CFO, reviewed by auditors, and subject to securities fraud liability if they misrepresent material facts. Which makes them, paradoxically, the most honest documents in the auto industry.
We pulled the latest annual filings for seven of the biggest automakers on earth -- General Motors, Ford, Tesla, Toyota, Volkswagen, Stellantis, and Hyundai -- and read them cover to cover. Not the press releases. Not the earnings call transcripts. The actual filings, submitted to the SEC or published as statutory annual reports. What we found is that each company’s filing reads like a strategic fingerprint: the terms they use, the risks they disclose, the numbers they emphasize, and the ones they bury all tell a story about where management is actually placing its bets.
Here’s what we analyzed:
General Motors: 10-K (FY2025, filed January 2026) + 10-Q (Q1 2026)
Ford Motor Company: 10-K (FY2025, filed February 2026) + 10-Q (Q1 2026)
Tesla: 10-K (FY2025, filed January 2026) + 10-Q (Q1 2026)
Toyota Motor Corporation: 20-F (FY2025, ending March 2025) + Financial Summary
Volkswagen Group: 2025 Annual Report (published March 2026)
Stellantis NV: 20-F (FY2025, filed February 2026)
Hyundai Motor Company: 2025 Annual Results + CEO Investor Day Presentation
Between them, these companies sold roughly 43 million vehicles in their most recent fiscal year, generated over $1.4 trillion in combined revenue, and spent more than $80 billion on R&D.
How to Read an OEM Filing Like a Strategy Document
A 10-K is not organized like a strategy deck. The signal is scattered. But if you know where to look, a handful of sections tell you nearly everything:
Segment reporting is where the company admits which businesses make money. Ford’s three-segment structure (Blue, Model e, Pro) is the gold standard for transparency. Most OEMs bury EV economics inside regional or brand-level reporting.
Risk factors are where management names the threats lawyers believe are material. When a risk moves from boilerplate to detailed disclosure, something changed.
R&D and capital expenditure are where ambition becomes cash. A company can say anything on an earnings call; the R&D line tells you what it’s actually funding.
Impairments and restructuring charges are where past strategy gets marked down. An impairment is not just an accounting charge -- it’s a revised view of the future.
Word patterns are not perfect evidence, but they’re a useful signal. When “hybrid” moves from footnote to centerpiece across multiple filings, that’s an industry shift, not a vocabulary preference. When “AI” appears 50 times in one filing and twice in another, management attention is visibly different.
The Financial Fingerprints
Before diving into language and strategy, here’s the baseline:
OEM | Revenue | Op. Margin | R&D Spend | Vehicles Sold | Cash Position |
|---|---|---|---|---|---|
Toyota | $331B (¥48.0T) | 10.0% | $8.7B (¥1,326B) | 9.36M | $62B (¥8.98T) |
VW Group | $350B (€321.9B) | 2.8% (4.6% adj.) | $23.7B (€21.8B) | 9.0M | $37.5B (€34.5B net liq.) |
GM | $185B | ~1.6% | $8.5B | 6.18M | $20.5B |
Ford | $187B | Net loss | ~$8.7B | ~4.4M | $28.7B |
Stellantis | $167B (€153.5B) | -0.5% | N/A disclosed | ~5.5M | Negative FCF |
Hyundai | $128B (KRW 186.3T) | 6.2% | ~$5.1B (KRW 7.4T) | 4.14M | N/A |
Tesla | $94.8B | 4.6% | $6.4B | 1.64M | $44B |
A few things jump out immediately. Toyota is the most profitable major automaker in the world by a wide margin -- its 10% operating margin is more than three times GM’s and nearly four times VW’s adjusted figure. Volkswagen spends more on R&D than any automaker on earth -- $23.7 billion, nearly four times Tesla’s $6.4 billion -- and yet its software division CARIAD is still losing over $2 billion per year. Tesla, the smallest company by vehicle volume, is sitting on $44 billion in cash -- more than any OEM except Toyota.
And then there’s Stellantis, which posted the first annual net loss in the company’s history: negative €22.3 billion, driven by €25.4 billion in write-downs. That write-down is larger than most OEMs’ entire annual operating profit.
The Language Test: What Each Company Talks About
The most revealing thing about a 10-K isn’t what it says -- it’s how often it says it. When a company mentions a term dozens of times in its risk factors and MD&A, that’s where management’s attention actually lives. When a term barely appears, that’s what the company hasn’t prioritized -- regardless of what the CEO says at CES.
US-Headquartered OEMs:
Theme | GM | Ford | Tesla |
|---|---|---|---|
EV / battery | High | High | Core identity |
Hybrid | Moderate | Moderate | Zero |
Software | High | Moderate | Very high |
AI / autonomy | Moderate | Low | Central thesis |
Restructuring | High | Very high | Moderate |
China / tariff | High | Moderate | Moderate |
Commercial / fleet | Moderate | Very high | Low |
Hydrogen | -- | -- | -- |
Robotics | -- | -- | Central |
Energy storage | Low | Low | Central |
Global OEMs:
Theme | Toyota | VW | Stellantis | Hyundai |
|---|---|---|---|---|
EV / battery | Moderate | High | Moderate | High |
Hybrid | Dominant | Moderate | Moderate | Very high |
Software | Low | Very high | Low | Moderate |
AI / autonomy | Low | Moderate | Minimal | Moderate |
Restructuring | Low | Very high | Very high | Low |
China / tariff | Moderate | Very high | Moderate | Moderate |
Commercial / fleet | Moderate | Moderate | Moderate | Moderate |
Hydrogen | Moderate | Low | -- | Moderate |
Robotics | -- | -- | -- | -- |
Energy storage | Low | Low | -- | Low |
Three patterns stand out.
Tesla doesn’t sound like an automaker anymore. Its 10-K reads more like a technology conglomerate’s filing than a car company’s. The words “AI,” “robotics,” “energy storage,” and “autonomous” appear throughout -- and they’re not aspirational footnotes, they’re describing revenue-generating business segments. Tesla’s energy division did $12.8 billion in revenue in FY2025, deployed 46.7 GWh of storage, and launched a Robotaxi service in June 2025. Its R&D spending jumped 41% to $6.4 billion, driven by AI compute infrastructure -- and the 10-K now carries “AI infrastructure” as a $7.7 billion line item on the balance sheet, a category that doesn’t exist on any other OEM’s books. No other OEM’s filing contains the sentence “developing and commercializing AI robots” as a core business description.
VW writes like a company trying to restructure in real time. “Restructuring,” “cost reduction,” and “investment discipline” are everywhere. The filing targets 50,000 job cuts across the group by 2030 -- including 7,500 at Audi, 3,900 at Porsche, and 1,600 CARIAD software engineers (30% of the division) -- with €15 billion in annual savings targeted. CFO Arno Antlitz stated in the annual report that the 4.6% adjusted margin “is not sufficient in the long run.” Porsche -- historically VW’s crown jewel -- posted a 0.3% operating margin, down from approximately 17%. The Rivian and Xpeng software partnerships are, in filing language, an admission that CARIAD’s internal software development failed after billions in investment.
Toyota barely mentions software, AI, or autonomy. Its filings use phrases like “make ever-better cars,” “product-centered and region-centered management,” and “producing happiness for all.” The Toyota Mobility Concept is structured in three stages: Mobility 1.0 (cars to mobility), Mobility 2.0 (expanding access), Mobility 3.0 (mobility and infrastructure working together). The language is deliberately steady -- almost conservative. And yet Toyota posted a 10% operating margin while selling 9.36 million vehicles. The company that talks least like a software company may be the one with the most strategic freedom, because its balance sheet and hybrid economics give it time.
The Risk Factor Reveal
Every 10-K includes a section titled “Risk Factors” -- a legally required disclosure of things that could materially harm the business. When you read seven of them side by side, the differences are telling:
Risk Factor | Who Discloses It | Who Doesn’t |
|---|---|---|
CEO governance/distraction risk | Tesla (Musk’s multi-company roles) | Everyone else |
Software development failure | VW (CARIAD), GM (Cruise impairment) | Toyota, Hyundai |
EV demand uncertainty | GM, Ford, VW, Stellantis | Tesla, Toyota, Hyundai |
Robotaxi regulatory risk | Tesla | Everyone else |
Hydrogen viability | Toyota, Hyundai | GM, Ford, Tesla, VW, Stellantis |
Multi-brand complexity | VW (14+ brands), Stellantis (14+ brands) | Tesla, Toyota, Hyundai |
Leadership transition risk | Stellantis (CEO departure) | Everyone else |
China JV income dependency | GM, VW | Tesla (owns factory), others |
Union labor relations | GM, Ford, Stellantis | Tesla, Toyota, Hyundai (US non-union) |
Ford deserves specific credit for transparency. It’s the only major OEM that breaks its financial reporting into three clearly defined segments -- Ford Blue (ICE and hybrid), Ford Model e (electric), and Ford Pro (commercial) -- each with its own revenue and EBIT disclosure. In FY2025, that transparency revealed Ford Pro generated $66 billion in revenue and $6.8 billion in EBIT with double-digit margins, while Ford Model e lost $4.8 billion ($27,000 per vehicle sold) and took an $8.4 billion impairment charge. Ford also cancelled three planned EVs and ended F-150 Lightning production. A hidden loss is not a smaller loss. Ford’s willingness to show the EV economics may make it look worse in some comparisons, but it also creates internal accountability other OEMs don’t have.
Stellantis disclosed something no other OEM had to: it lost its CEO. Carlos Tavares departed in December 2024, and the FY2025 filing describes a “renewed leadership team” executing a “strategic reset.” The €25.4 billion in write-downs -- classified as “resetting the product plan and EV supply chain to reflect customer demand” -- is the filing equivalent of admitting the previous strategy was wrong. The words “customer preferences and freedom-of-choice” appear repeatedly, which is not filler. It signals a move away from the rigidly cost-optimized, product-push model Tavares was known for.
The Strategic DNA Stoplight Grid
Based on what the filings actually say -- not press releases or CES keynotes:
US-Headquartered OEMs:
Dimension | GM | Ford | Tesla |
|---|---|---|---|
Financial resilience | 🟡 | 🟡 | 🟢 |
EV economics | 🟡 | 🔴 | 🟢 |
Software / SDV | 🟡 | 🟡 | 🟢 |
Autonomous driving | 🟡 | 🔴 | 🟢 |
Powertrain flexibility | 🟢 | 🟢 | 🔴 |
China positioning | 🟡 | 🟡 | 🟢 |
Tariff preparedness | 🟡 | 🟡 | 🟡 |
Cost discipline | 🟡 | 🟡 | 🟢 |
R&D intensity | 🟢 | 🟡 | 🟡 |
New business diversification | 🟡 | 🟡 | 🟢 |
Global OEMs:
Dimension | Toyota | VW | Stellantis | Hyundai |
|---|---|---|---|---|
Financial resilience | 🟢 | 🟡 | 🔴 | 🟢 |
EV economics | 🟡 | 🟡 | 🔴 | 🟢 |
Software / SDV | 🔴 | 🔴 | 🔴 | 🟡 |
Autonomous driving | 🟡 | 🟡 | 🔴 | 🟡 |
Powertrain flexibility | 🟢 | 🟡 | 🟢 | 🟢 |
China positioning | 🟢 | 🔴 | 🔴 | 🟡 |
Tariff preparedness | 🟡 | 🔴 | 🟡 | 🟢 |
Cost discipline | 🟢 | 🟡 | 🔴 | 🟢 |
R&D intensity | 🟢 | 🟢 | 🟡 | 🟡 |
New business diversification | 🟡 | 🟡 | 🔴 | 🟡 |
🟢 Strong 🟡 Moderate 🔴 Limited
The grid reveals four distinct operating archetypes:
The Technology Pivot (Tesla): Green across software, autonomy, and new business -- but it’s a fundamentally different kind of company now. Its 10-K describes a business that makes cars, stores energy, deploys autonomous taxis, and builds humanoid robots. The most important growth line in Tesla’s filing may not be vehicles. It may be energy deployment: in a year when auto revenue was pressured, energy grew 114%.
The Operational Fortress (Toyota, Hyundai): Strong on financial health, cost discipline, and pragmatic electrification. Toyota’s multi-pathway approach -- hybrids today, BEVs when cost-effective, hydrogen for long-haul -- is reflected in stable margins and enormous cash reserves. Hyundai’s “flexible powertrain strategy” mirrors Toyota’s but with a more aggressive electrification timeline (60% electrified by 2030, 18+ hybrid models, EREVs from 2027). Both companies conspicuously avoid software hype. Neither shows up red on cost discipline or financial resilience.
The Struggling Transition (GM, Ford, VW): These are the companies that committed to massive EV investments -- GM’s $35 billion through 2025, Ford’s Model e segment, VW’s €73 billion five-year plan -- and are absorbing the cost. Margins are compressed, impairments are accumulating, and the filings are full of “realignment,” “restructuring,” and “cost reduction.” GM’s $7.9 billion in EV strategic realignment charges (plus the earlier Cruise pivot), Ford’s $13.8 billion in Q4 EV-related charges, and VW’s CARIAD losses plus Porsche margin collapse all represent revised views of the future.
The Crisis (Stellantis): A company in genuine distress. The filing reads like a turnaround document: new leadership, €25.4 billion in write-downs, product plan reset, and repeated emphasis on “customer preferences” that suggests the prior leadership ignored them. The $13 billion US investment commitment is forward-looking, but the filing itself is still processing what went wrong.
The Counter-Intuitive Details
Each filing contains at least one detail that complicates the easy narrative:
OEM | Detail | Why It Matters |
|---|---|---|
GM | Took $7.9B in EV realignment charges while simultaneously investing $1B in V8 engine production and spending $6B on share buybacks | GM is walking back EV bets, protecting ICE profit pools, and returning cash to shareholders -- all in the same year |
Ford | Model e lost $27,000 per vehicle; Ford cancelled 3 EVs and ended F-150 Lightning production | Ford’s segment transparency makes EV pain visible -- but it also led to faster course-correction than OEMs still hiding losses |
Tesla | Energy revenue ($12.8B, 39.5% gross margin in Q1 2026) grew while auto revenue declined; “AI infrastructure” is now a $7.7B balance sheet line item | The company’s growth identity is expanding beyond vehicles in the actual numbers -- and it’s guiding CapEx >$25B for 2026, mostly for AI compute |
Toyota | Lowest software rhetoric, highest operating margin | Raises the uncomfortable question of whether narrative intensity is overrated |
VW | Spends $23.7B on R&D -- more than any OEM -- yet CARIAD still loses $2.2B | R&D spend is an input, not a result. The question is conversion, not volume. |
Stellantis | €25.4B write-down larger than most OEMs’ total annual operating profit | This isn’t a bad quarter. It’s a strategic admission that the product plan was wrong. |
Hyundai | 635,000 hybrids sold (vs. 275,000 EVs) with overall 6.2% margin | The company betting most heavily on powertrain flexibility is also the one with the most balanced financial results |
Five Cross-OEM Lessons From the Filings
1. EV strategy has fractured into at least five strategies. Tesla treats EVs as part of an AI-energy-robotics system. Ford separates EV losses for accountability. GM hedges with truck profits. Toyota and Hyundai lead with hybrids. VW and Stellantis are in EV-related restructuring. The industry didn’t abandon EVs -- it abandoned the idea that adoption would move in a straight line.
2. Hybrids are no longer a bridge -- they’re a profit tool. Toyota and Hyundai make this clearest. Hyundai sold 635,000 hybrids in FY2025, up 27.9%, with record market share of 15.3%. Hybrids address charging infrastructure gaps, battery cost volatility, consumer affordability concerns, tariff uncertainty, and emissions compliance pressure simultaneously. The filings treat hybrids as strategic architecture, not a delay tactic.
3. Impairments are strategy written in accounting ink. GM’s Cruise charge says robotaxi timing changed. Ford’s Model e pressure says EV unit economics changed. Stellantis’s write-downs say prior product assumptions didn’t match the market. VW’s CARIAD restructuring says internal software execution fell short. An impairment is a revised view of the future, and FY2025 produced a lot of revised views.
4. R&D spend is not destiny. VW’s $23.7 billion R&D budget is nearly five times Tesla’s. But VW’s software division is being restructured, its margin is under 3%, and it’s turning to Rivian and Xpeng for architecture it couldn’t build internally. Meanwhile, Toyota spends $8.7 billion and posts a 10% margin. The question isn’t who spends the most -- it’s who converts engineering spend into products, margins, and market position.
5. China is both market and structural competitor. The filings show China in two roles. For GM and VW, China is a market where joint ventures and pricing pressure are reducing profitability -- VW saw China deliveries drop 6%, GM’s JV equity income has been declining for years. For the industry as a whole, Chinese OEM exports (approximately 3 million vehicles annually to Europe and emerging markets) create pressure in segments where Western OEMs have relied on pricing power. China is no longer just growth exposure in the risk factors. It’s a structural competitive force.
What This Means for Procurement and Supply Chain Leaders
If you’re a procurement leader or supplier reading this, the filings tell you something specific about the companies you’re selling to or buying from. Understanding supplier relationship dynamics starts with knowing what your customer’s balance sheet looks like.
An OEM whose filing is dominated by “restructuring” and “cost reduction” is going to squeeze suppliers harder. VW’s and Stellantis’s filings are practically telegraphing procurement pressure -- a dynamic the 2026 Working Relations Index already captured from the supplier side. When VW’s CFO says the current margin “is not sufficient,” every supplier in VW’s supply base should hear that as a warning.
An OEM emphasizing “software” and “AI” needs different suppliers -- or different capabilities from existing ones. Tesla’s supply chain already looks more like a tech company’s than an automaker’s: semiconductor suppliers, compute hardware, battery chemistry partners, and AI training infrastructure.
An OEM with high cash reserves and stable margins -- Toyota, Hyundai -- is likely to be a more predictable customer for direct materials suppliers. Their filings don’t show the wild swings in product strategy that create chaos for supplier quote pipelines.
And an OEM posting massive write-downs and negative free cash flow is a customer whose purchase orders carry more risk than they did two years ago. The filings don’t just tell you about the OEM’s strategy. They tell you about the reliability of your own revenue forecast.
A Caveat Worth Taking Seriously
The biggest objection to this exercise is fair: 10-Ks and 20-Fs are compliance documents, not operating plans. They’re backward-looking, conservative, and shaped by legal risk. Word frequency can mislead -- “battery” may appear often because of supply-risk disclosure, not because of strategic conviction. A company may mention “software” rarely because it treats software as embedded engineering rather than a separate narrative.
So filings should not be read alone. But they’re valuable because they create a floor of seriousness. A CEO can float a vision on stage. A 10-K must reconcile ambition with impairment charges, capital commitments, segment losses, tariffs, restructuring, and cash.
The 10-K is the one document where the CEO can’t spin. The numbers have to add up. The risks have to be disclosed. And the language, if you read it carefully enough, tells you where the company is actually going -- not where the marketing says it’s going.
Sources
General Motors 10-K FY2025 -- SEC EDGAR annual filing
Ford Motor Company 10-K FY2025 -- SEC EDGAR annual filing
Tesla 10-K FY2025 -- SEC EDGAR annual filing
Toyota 20-F FY2025 -- SEC EDGAR annual filing
Toyota FY2025 Financial Summary -- Consolidated results
Volkswagen Group 2025 Annual Report -- Full-year results
VW Group 2025 Press Release -- Financial details
Stellantis FY2025 Results -- Net loss and strategic reset
Stellantis 20-F FY2025 -- SEC EDGAR annual filing
Hyundai Motor 2025 Annual Results -- Revenue, margins, electrification
Hyundai CEO Investor Day 2025 -- 2030 roadmap
PwC Automotive Outlook 2026 -- Industry analysis
S&P Global Automotive Trends 2026 -- Market overview
BCG 2026 Automotive Supplier Study -- Supplier dynamics
Frequently Asked Questions
What is a 10-K filing and why does it matter for understanding OEM strategy?
A 10-K is the annual report that US-listed companies must file with the Securities and Exchange Commission. Unlike press releases, a 10-K is a legal document -- the CEO and CFO personally certify its accuracy, and misstatements can lead to securities fraud charges. Foreign-listed automakers file an equivalent 20-F form. These filings are the most reliable source for understanding a company’s actual financial position, strategic priorities, and risk perception because the consequences for misrepresentation are real.
Which automotive OEM spends the most on R&D?
Volkswagen Group leads all automakers globally with approximately $23.7 billion (€21.8 billion) in R&D spending for FY2025, more than double its nearest competitor. Toyota spends roughly $8.7 billion, GM approximately $8.5 billion, and Ford around $8 billion. Tesla spends $6.4 billion on R&D -- though on a per-vehicle basis, Tesla’s R&D intensity is significantly higher. VW’s case is instructive: the largest R&D budget hasn’t prevented software execution issues at CARIAD or the need for external partnerships with Rivian and Xpeng.
Why does Ford’s 10-K get credit for EV transparency?
Ford is the only major OEM that breaks out its financial results into Ford Blue (ICE and hybrid), Ford Model e (electric), and Ford Pro (commercial) -- each with separate revenue and EBIT disclosure. This makes Ford Model e’s $4.8 billion EBIT loss clearly visible while also showing that Ford Pro is a $66 billion business with $6.8 billion in EBIT. Other OEMs bury equivalent EV losses within broader segments, which can obscure the true cost of the electrification transition.
How does reading 10-K risk factors help predict supplier relationships?
An OEM whose filing emphasizes “restructuring,” “cost reduction,” and margin pressure -- like VW (whose CFO called the current margin “not sufficient”) or Stellantis (€25.4 billion in write-downs) -- is likely to intensify procurement negotiations and squeeze supplier margins. Conversely, OEMs with stable margins and high cash reserves (Toyota at 10% operating margin and $62 billion in cash, Hyundai at 6.2% margin) tend to be more predictable customers. Reading the risk factors of your customers’ filings tells you about the reliability of your own revenue forecast.
What is the most surprising finding from comparing these seven OEM filings?
The most counter-intuitive finding is that the company spending the least time talking about software and AI -- Toyota -- has the highest operating margin (10%) and the largest cash reserves ($62 billion) of any major automaker. Meanwhile, the company spending the most on R&D -- Volkswagen at $23.7 billion -- has a 2.8% operating margin and is cutting 50,000 jobs and is restructuring its software division after years of losses. This suggests that narrative intensity around technology trends does not correlate with financial performance, at least not in the near term.
Are hydrogen fuel cells still relevant based on what OEM filings disclose?
Hydrogen appears as a meaningful strategic theme in only two of the seven filings: Toyota (part of its multi-pathway electrification strategy) and Hyundai (which lists “H2 Solution” as one of three strategic pillars). For GM, Ford, Tesla, VW, and Stellantis, hydrogen has effectively disappeared from the regulatory filings -- a quiet industry concession that battery electric has won the near-term argument for passenger vehicles, even if hydrogen may retain a role in heavy-duty transport.
Read more


Read more
Read more
Faster sourcing. Lower cost. Less chaos.
See how LightSource connects engineering, procurement, and suppliers in one operating system to help you launch faster at lower cost.
SOC 2
Kearney #1 2024
Gartner Cool Vendor
Procuretech 100
G2 Top Rated
Faster sourcing. Lower cost. Less chaos.
See how LightSource connects engineering, procurement, and suppliers in one operating system to help you launch faster at lower cost.
SOC 2
Kearney #1 2024
Gartner Cool Vendor
Procuretech 100
G2 Top Rated
Faster sourcing. Lower cost. Less chaos.
See how LightSource connects engineering, procurement, and suppliers in one operating system to help you launch faster at lower cost.
SOC 2
Kearney #1 2024
Gartner Cool Vendor
Procuretech 100
G2 Top Rated
Trusted by:
Trusted by:
Trusted by: